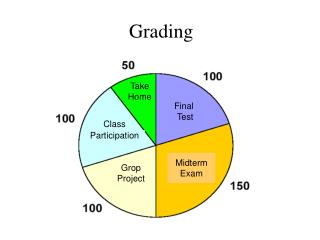
Equal Interval Grading
Equal Interval Grading. Mr. Mike Emery Assistant Principal Robert E. Fitch High School. Equal Interval Grading Scale. Traditional Grading. Example: Student A earns what is traditionally an 80, 80, 81, 74, and a 30. Student A traditional average : 69, Letter Grade = D+

Equal Interval Grading
E N D
Presentation Transcript
Equal Interval Grading Mr. Mike Emery Assistant Principal Robert E. Fitch High School
Traditional Grading • Example: • Student Aearns what is traditionally an 80, 80, 81, 74, and a 30. • Student A traditional average : 69, Letter Grade = D+ • Student B earns what is traditionally an 90, 90, 91, 84, and a 65. • Student B traditional average : 84, Letter Grade = B
0-5 Equal Interval Grading • Student Aearns 80, 80, 81, 74, and a 30. • Teacher enters 3.0, 3.0, 3.1, 2.4, and .5 into PowerSchool • PowerSchoolfinds the average of those 5 numbers: 2.4 • Student B earns 90, 90, 91, 84, and a 65. • Teacher enters 4.0, 4.0, 4.1, 3.4, and 1.5 into PowerSchool • PowerSchool finds the average of those 5 numbers: 3.4
0-5 Percentages • Student C receives a traditional 90 (A-). • In 0-5 grading this would be a 4.0 • PowerSchool takes the 4.0 and divides by 5 (because 5 is the highest grade you can get) and calculates 80%. • This student would receive a B- if we left PowerSchool alone. • So we created different percents for the 0-5 scale.
0-5 Percents • For example: We want the 4 to be an A- so we made the A range run from 80-100% • We want 3 to be a B- so we made the B range run from 60-79…. • And so on
We know at this point that Student A has a C average (see the chart above). • However, PowerSchoolcannot just assign the grade at this point. It needs to convert to a percentage. • PowerSchooltakes the 2.4 and divides by 5 to get 48%. • PowerSchoolconverts the 48% to a letter grade (C), using the chart above.