Developments in Radiation Detection Systems
Developments in Radiation Detection Systems. By Alex Rak 03/17/2011. Presentation Outline. About Me Introduction to Scintillation Detectors Scintillation Detector System Mechanical Design Test Procedure Final Results Introduction to Gamma Cameras Gamma Camera System Theory

Developments in Radiation Detection Systems
E N D
Presentation Transcript
Developments in Radiation Detection Systems By Alex Rak 03/17/2011
Presentation Outline • About Me • Introduction to Scintillation Detectors • Scintillation Detector System • Mechanical Design • Test Procedure • Final Results • Introduction to Gamma Cameras • Gamma Camera System • Theory • Test Procedure • Results • Summary
About Me Bardeen Engineering Fellowship Candidate Age: 23 Hometown: Burlington, IL Education: • B.S. in Mechanical Engineering from Bradley University • M.S. in Mechanical Engineering from Bradley University Expected in May
About Me Continued Work Experience: • Graduate Researcher, Bradley University (May-Dec. 2010) • Graduate Assistant, Bradley University (Aug.-Dec. 2009) • Drafting Intern, Flexible Steel Lacing Co. (Summer 2007) Other Experience: • President, Sigma Phi Epsilon Fraternity (2006-2007) • Vice-President, Inter-Fraternity Council (2008-2009) • Senator, Student Senate (2006)
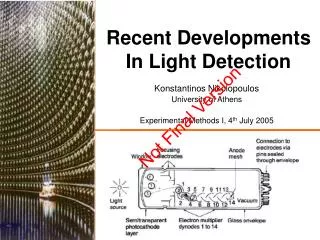
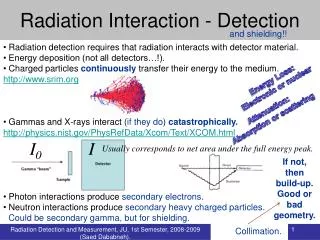
Scintillation Detectors 2 Key Components: • Scintillation Crystal • Can be Crystal, Plastic, Liquid, or Glass • Photomultiplier Tube • Contains Photocathode, Several Dynodes, and an Anode
How Scintillation Detectors Work • Scintillation Light is Released when Struck by Ionizing Radiation • Converts Gamma Rays to Visible Blue Light • The Light is Converted into an Electric Pulse by the Photocathode • The Signal is then Amplified in the Photomultiplier Tube by Passing Through a Series of Dynodes Until it Reaches the Anode
Senior Project • Funded by Los Alamos National Laboratory (LANL) • Est. 1943 in Los Alamos, NM 87545 • LANL wanted an Automated Omni-Directional Sensor to Locate Radioactive Material • Contacts at LANL • Dr. Gregory Dale • Dr. Michele DeCroix • Mr. Robert Wheat
System Requirements • Use Standard 3 in. Right Circular Cylinder NaI Detector • Detect and Locate Source Within 10 Minutes • Transportable Pieces Weighing Less than 60 lbs. • Locate the Source Within 1 ft. of Actual Location at a Distance of 5 ft. from the Detector • Scans Continuously Without User Feedback • Scan an Area 90⁰ Left and Right of Center and 60⁰ Down
System Design • Motorized Linear Slide was Used to Move Scintillation Detector in and out of a Collimator • 1.7 in. Thick Lead Cylinder Used for the Collimator • Second and Third Motor Used to Tilt and Rotate the Entire System • 100:1 Gearbox Used with Both Motors • Ball Bearings were Used to Smooth the Movement of the Device
Motor Mount Analysis • Made from A36 Hot Rolled Steel Plate • Yield Strength of 400 MPa • Max Stress – 180 kPa • Max Deformation - 3.3 x 10⁻⁴ mm
Scintillation Detector Arm Analysis • Built from ¾ in. OD Mild Steel Tubing • Yield Strength of 500 MPa • Max Stress – 44.8 MPa • Max Deformation – 0.5 mm
Base Analysis • Constructed out of 6061 Aluminum • Yield Strength of 275 MPa • Max Stress – 53.9 MPa • Max Deformation – 0.8 mm
A-Frame Analysis • Modeled with a Truss Analyzer • Built from ¾ in. OD Mild Steel Tubing • Yield Strength of 500 MPa • Max Stress – 1.2 MPa • Buckling Factor of Safety – 2031 Forces: Buckling: ∑Fx = 0 σact= F1-2/A ∑Fy= 0 σallow = Pcrit/A Pcrit= π2EI/(KL)2 n =σact /σallow
Search Algorithm • A C++ Compiler was Used to Determine the Next Step in the Search Algorithm • Based on Concepts of Windowing and Interpolation • There were 4 Stages to the Algorithm • Every Scan was Taken for 30 sec. • The Locations of the Sections, the Positions of the Motors, and the Depth of the Scintillation Detector were Calculated and Set in the C++ Code • Poisson Statistics were Used to Determine if the Scintillation Detector saw a Source of Radiation in a Particular Section
Statistics • Scanning with the Scintillation Detector Yields a Value with Units of Counts/Second • The Background Radiation, or B, with no Source Present was Recorded for the Testing Room • Each Scan Yields a Total Counts, T • The Source Counts/Second, or S, is Found Using the Following Equation S=T-B • The Standard Deviation of the Source Counts of the Initial Scan was Determined Following the Rules of Poisson Statistics σinitial=√(Ti+B)
Statistics Continued • A Threshold of 3 was Chosen to Determine if the Source was Within a Window • This is Represented in the Equation Below S/σinitial≥3 • If the Threshold Condition is met by the Counts in a Particular Window, the Source is Determined to be in that Window • The Scan then Moves to the Next Stage and Continues from the Window with the Source
Stages 1 and 2 • Stage 1 is the Initial Search and Scans the Entire Search Area • By Increasing the Detector’s Depth in the Collimator, its Circular Viewing Area was Decreased • Positioning was Adjusted so the Circular Viewing Area Encompassed the Entire Rectangular Window Stage 2 - Windowing Detector Depth = 1.29”
Stages 3 and 4 Stage 4 - Interpolation Detector Depth = 5.26” Stage 3 - Windowing Detector Depth = 3.59”
Stage 4 Continued • The Interpolation Stage Records the Values in All 4 Quarters and Plugs them into the this Equation • In this Equation, x is the Angle Off the Center Axis of the Scintillation Detector and y is the Counts/Second • The Angle Off the Center Axis is Used as the Radius of a Circle that is Centered in the Middle of Each Quarter • It is Known that the Quarter with the Highest Recorded Counts Contains the Source • This Quarter will have the Smallest Value for the Angle Off the Center Axis and Therefore the Smallest Circle
Final Source Location • The Intersections of the Circles Provide a More Accurate Location • The Black Dots are the Intersections of the Circles and the Red Dot is the Experimental Source Location
Test Setup • A 10 μCi Source of Cesium-137 was Used • 30 Scans were Performed with the Source at Random Locations • 4 of the Sources were Placed Outside of the Required Search Area to Test for False Positives • The Sources were Placed at Different Distances from the Scintillation Detector Ranging from 1.1 to 8 ft. • These Distances Corresponded to the Limits of the Detector
Results • The 4 Sources Placed Outside the Search Area were not Found as Expected • All 26 Sources Placed Within the Area were Found Within the Tolerance Required • The Average Distance from the Experimental Source to the Actual Source was 4.5 in. • The Entire System was Designed to Break Apart into 3 Pieces Each Weighing 54 lbs. • One Full Scan Took About 9.5 Minutes to Run
Gamma Cameras Components: • Large, Thin Sheet of Scintillation Crystal • Can have a Collimator in Front of the Crystal • Array of Small Photomultiplier Tubes • Complex Electronics to Interpret Signal and Send to Computer
Gamma Cameras Continued • The Size of the Crystal can Vary Depending on the Application • The More Photomultiplier Tubes in the Array, the Better the Spatial Resolution • Position of the Incident Gamma Ray is Calculated Using the Signal Measured in the Surrounding Photomultiplier Tubes
Gamma Camera System Goals • Design a System that can be Easily Integrated with a Standard Gamma Camera • Develop a more Accurate Method for Determining the Location of a Source of Radiation • Design a System that can be Used for Different Radioactive Sources • Eliminate the Need for Moving Parts to Reduce the Chances of Failure
System Theory • By Suspending a Lead Bar in Front of the Gamma Camera in a Known Location, a Portion of the Incident Radiation is Blocked • When the Data Recorded by the Camera is Converted into an Image the Portion that was Partially Blocked will Appear as a Shadow • The Direction of the Origin of the Radiation can be Found from this Image by Using some Transforms and Geometry
Lead Bar Design • Lead Bar was Sized at 0.4 x 2 x 10 in. • 0.4 in. was the Thickness Required to Stop 99% of the Radiation from the 10 μCi Cesium-137 Source Determined Using Lambert’s Law I(x)=I0e-αx where α = linear attenuation coefficient x = length of material and I0 = initial intensity • The Length and Height were Chosen Because they Matched Standard Sizes from the Manufacturer, NucLead
Lead Bar Apparatus • Standard Plumbing Pipes and Fittings were Used to Keep the Costs Low • Thin L-Brackets were Used to Hold the Bar in Place to Minimize the Interference with the Final Image • The Bar was Suspended 2 in. Away from the Camera Screen, with its Longest Side Horizontal, and with its Thinnest Face Oriented Up and Down • This Configuration Provided the Best Image
Apparatus Image • The Metal Fittings in the Apparatus Blocked a Negligible Amount of the Radiation
Gamma Camera Procedure • Measure the Background Radiation in the Test Room with no Source Present with a 600 sec. Scan • Place the Lead Bar in the Apparatus and the Cesium-137 Source in a known Location • Initiate a 600 sec. Scan to Record the Incident Radiation from the Source • Import the Background and Source Scans into the Wolfram Mathematica Code • Import the Mathematica Output File into the MATLAB Code as an Image and Determine Experimental Source Location
Scanning Software Syngo: • Software Installed on Siemens Workstation that is Used to Setup the Type and Length of a Scan • Outputs a List of Energies and Positions of all Gamma Events Siemens e.soft: • Directly Connected to the Gamma Camera • Transmits the Information Recorded by the Camera to the Syngo Workstation
Scanning Hardware Siemens e.cam Gamma Camera: • Non-Production Test Model • 3/8 in. Thick NaI(Tl) Crystal • 16 x 22 in. Viewing Area • Array of 59 Photomultiplier Tubes • 53 with a 3 in. Diameter • 6 with a 2 in. Diameter
Mathematica Code • Originally Developed by Dr. John Engdahl in 2009 • Creates a List of Gamma Events • Subtracts Background Radiation • Removes Markers Placed in the List by e.soft • Eliminates Values Beyond 1 Standard Deviation of the Mean • Outputs a Comma Separated Value File that Can be Opened as a Matrix or Image
MATLAB Code • Performs a Mean and Median Filter to Image − 3 x 3 Filter Kernel • Imports the CSV File as an Image
MATLAB Code Continued • Performs a Hough Transform to Find the Location of the Edges • Finds Edges Using Built-in Canny Edge Finder
Hough Transform • Take all the Points in an Image and Transforms them into Parameter Space • Each Point is Assigned a Line Equation Containing a Sine and Cosine Term xicosθ + yisinθ = ρ • These Lines are Plotted Over a Specified Range of the Parameters ρ and θ • The Intersections of the Sine and Cosine Lines Correspond to Line in Real Space • The Endpoints are Saved as Variables to be Used Later
Other Operations • Saves Values for the Known Position of the Lead Bar • Adjusts the Values of the Endpoints of the Lines so they are Relative to the Center of the Gamma Camera • Runs through Multiple If, Elseif, and Else Loops to Determine which Points Correspond to which Value and what Side of the Screen the Shadow is on • The Hough Transform Assigns the Values by their Order in Parameter Space and not Real Space • This Allows the same Naming System to be Used no Matter where the Shadow is Projected
Source Trajectory • Using the Endpoints Found through the Hough Transform, the Center of the Shadow is Determined • This Point is Connected with a Point at the Center of Mass of the Bar to Create a Line • The Experimental Source Location is at some Distance Along the Line • This Line can be Extended as far as Needed
Sample Result • The Images on Previous Slides came from a Scan with the Source Located at (12”, -4”, 60”) Relative to the Center of the Gamma Camera • After the Analysis was Finished the Experimental Source Trajectory Passed the Actual Location by 11.6” • Need to Take more Scans to see how the Source Location Affects the Result • Gamma Camera was Moved so it Needs to be Powered on and Calibrated
Ideal Test Results • Sketches were Created in Pro-E so Tests could be Performed Using Images with Ideal Edges • 12 Mock Source Locations were Used and Images were Created by Projecting Lines from the Source • The Same Code was Used to Analyze the Ideal Images • The Average Distance Away from the Actual Source Location was 2.4 in.
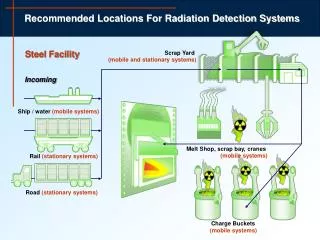
Example Usage • Shipping Container is Suspected of Containing Radioactive Material • Someone could Search the Entire Container with a Geiger Counter by Hand • Could Take a Long Time and Puts People in Danger • A Van Containing the Gamma Camera System could Park Next to the Container and Scan it • This would Narrow the Search Area Within the Container and Determine the Radiation Level of the Source
Improvements • Modify the Image Processing to get Better Edges from the Real Scan Images • Find an Experimental 3D Point Source Location Instead of a Trajectory through Space • Add Computer Codes to Completely Automate the Process • Output the Average Energy Level of Gamma Rays so the Type of Radioactive Material can be Determined
References • Gamma Cameras, David S. Graff Ph.D. • Attenuation of Radiation in Matter, Peter B. Siegel Ph.D. • The Gamma Camera, UBC Physics & Astronomy • Interaction-Detectors, University of Waterloo • Detectors of Light, UC Davis University of California • Digital Image Processing, Rafael C. Gonzalez, Richard E. Woods
Acknowledgments • Senior Project Team • Keegan Roach • Derek Blunier • Eugene Kim • Dr. John Engdahl • Bradley University • Fermilab • Elaine G. McCluskey • Shelley A. Krivich • Bardeen Fellowship Committee
Summary • About Me • Introduction to Scintillation Detectors • Scintillation Detector System • Mechanical Design • Test Procedure • Final Results • Introduction to Gamma Cameras • Gamma Camera System • Theory • Test Procedure • Results