Performance Technology for Productive, High-End Parallel Computing
530 likes | 573 Views
Explore performance technology in parallel computing, scalability challenges, application tools, and TAU system developments. Discover the impact of large-scale parallel systems on performance observation, analysis, and experimentation.

Performance Technology for Productive, High-End Parallel Computing
E N D
Presentation Transcript
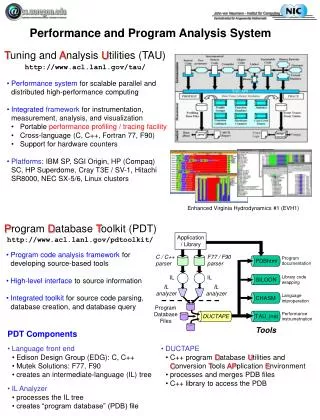
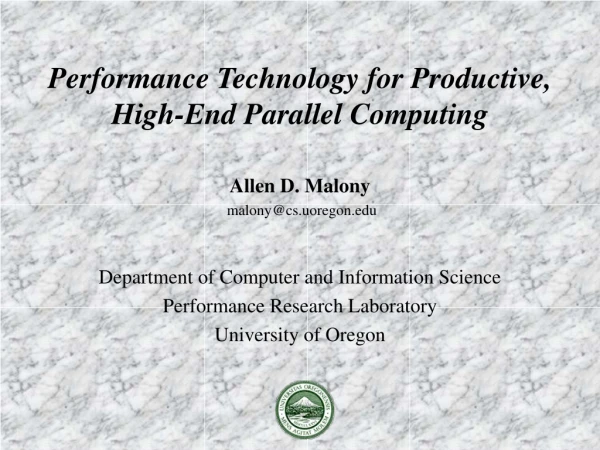
Performance Technology for Productive,High-End Parallel Computing Allen D. Malony malony@cs.uoregon.edu Department of Computer and Information Science Performance Research Laboratory University of Oregon
Outline of Talk • Research motivation • Scalability, productivity, and performance technology • Application-specific and autonomic performance tools • TAU parallel performance system developments • Application performance case studies • New project directions • Discussion
PerformanceTuning PerformanceTechnology hypotheses Performance Diagnosis • Experimentmanagement • Performancedatabase PerformanceTechnology properties Performance Experimentation • Instrumentation • Measurement • Analysis • Visualization characterization Performance Observation Research Motivation • Tools for performance problem solving • Empirical-based performance optimization process • Performance technology concerns
Problem Description • How does our view of this process change when we consider very large-scale parallel systems? • What are the significant issues that will affect the technology used to support the process? • Parallel performance observation is clearly needed • In general, there is the concern for intrusion • Seen as a tradeoff with performance diagnosis accuracy • Scaling complicates observation and analysis • Nature of application development may change • Paradigm shift in performance process and technology? • What will enhance productive application development?
Scaling and Performance Observation • Consider “traditional” measurement methods • Profiling: summary statistics calculated during execution • Tracing: time-stamped sequence of execution events • More parallelism more performance data overall • Performance specific to each thread of execution • Possible increase in number interactions between threads • Harder to manage the data (memory, transfer, storage) • How does per thread profile size grow? • Instrumentation more difficult with greater parallelism? • More parallelism / performance data harder analysis • More time consuming to analyze and difficult to visualize
Concern for Performance Measurement Intrusion • Performance measurement can affect the execution • Perturbation of “actual” performance behavior • Minor intrusion can lead to major execution effects • Problems exist even with small degree of parallelism • Intrusion is accepted consequence of standard practice • Consider intrusion (perturbation) of trace buffer overflow • Scale exacerbates the problem … or does it? • Traditional measurement techniques tend to be localized • Suggests scale may not compound local intrusion globally • Measuring parallel interactions likely will be affected • Use accepted measurement techniques intelligently
Role of Intelligence and Specificity • How to make the process more effective (productive)? • Scale forces performance observation to be intelligent • Standard approaches deliver a lot of data with little value • What are the important performance events and data? • Tied to application structure and computational mode • Tools have poor support for application-specific aspects • Process and tools can be more application-aware • Will allow scalability issues to be addressed in context • More control and precision of performance observation • More guided performance experimentation / exploration • Better integration with application development
Role of Automation and Knowledge Discovery • Even with intelligent and application-specific tools, the decisions of what to analyze may become intractable • Scale forces the process to become more automated • Performance extrapolation must be part of the process • Build autonomic capabilities into the tools • Support broader experimentation methods and refinement • Access and correlate data from several sources • Automate performance data analysis / mining / learning • Include predictive features and experiment refinement • Knowledge-driven adaptation and optimization guidance • Address scale issues through increased expertise
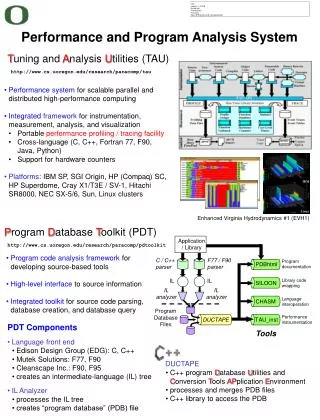
TAU Parallel Performance System Goals • Multi-level performance instrumentation • Multi-language automatic source instrumentation • Flexible and configurable performance measurement • Widely-ported parallel performance profiling system • Computer system architectures and operating systems • Different programming languages and compilers • Support for multiple parallel programming paradigms • Multi-threading, message passing, mixed-mode, hybrid • Support for performance mapping • Support for object-oriented and generic programming • Integration in complex software, systems, applications
TAU Instrumentation Advances • Source instrumentation • Program Database Toolkit (PDT) • automated Fortran 90/95 support (Flint parser, very robust) • statement level support in C/C++ (Fortran soon) • TAU_COMPILER to automate instrumentation process • Automatic proxy generation for component applications • automatic CCA component instrumentation • Python instrumentation and automatic instrumentation • Continued integration with dynamic instrumentation • Update of OpenMP instrumentation (POMP2) • Selective instrumentation and overhead reduction • Improvements in performance mapping instrumentation
TAU Measurement Advances • Profiling • Memory profiling • global heap memory tracking (several options) • Callpath profiling • user-controllable calling depth • Improved support for multiple counter profiling • Online profile access and sampling • Tracing • Generation of VTF3 traces files (portable) • Inclusion of hardware performance counts in trace files • Hierarchical trace merging • Online performance overhead compensation • Component software proxy generation and monitoring
TAU Performance Analysis Advances • Enhanced parallel profile analysis (ParaProf) • Performance Data Management Framework (PerfDMF) • First release of prototype • Callpath analysis integration in ParaProf • Integration with Vampir Next Generation (VNG) • Online trace analysis • Performance visualization (ParaVis) prototype • Component performance modeling and QoS
Component-Based Scientific Applications • How to support performance analysis and tuning process consistent with application development methodology? • Common Component Architecture (CCA) applications • Performance tools should integrate with software • Design performance observation component • Measurement port and measurement interfaces • Build support for application component instrumentation • Interpose a proxy component for each port • Inside the proxy, track caller/callee invocations, timings • Automate the process of proxy component creation • using PDT for static analysis of components • include support for selective instrumentation
Component Modeling and Optimization • Given a set of components, where each component has multiple implementations, what is the optimal subset of implementations that solve a given problem? • How to model a single component? • How to model a composition of components? • How to select optimal subset of implementations? • A component only has performance meaning in context • Applications are dynamically composed at runtime • Application developers use components from others • Instrumentation may only be at component interfaces • Performance measurements need to be non-intrusive • Users interested in a coarse-grained performance
Proxy Generator for other Applications • PDT-based proxy component for: • QoS tracking [Boyana, ANL] • Debugging Port Monitor for CCA (tracks arguments) • SCIRun2 Perfume components [Venkat, U. Utah] • Exploring Babel for auto-generation of proxies: • Direct SIDL to proxy code generation • Generating client component interface in C++ • Using PDT for generating proxies
Earth Systems Modeling Framework • Coupled modeling with modular software framework • Instrumentation for framework and applications • PDT automatic instrumentation • Fortran 95 • C / C++ • MPI wrapper library for MPI calls • Component instrumentation (using CCA Components) • CCA measurement port manual instrumentation • Proxy generation using PDT and runtime interposition • Significant callpath profiling use by ESMF team
TAU’s Paraprof Profile Browser (ESMF Data) Callpath profile
F Uintah Computational Framework (UCF) • University of Utah, Center for Simulation of AccidentalFires and Explosions (C-SAFE), DOE ASCI Center • UCF analysis • Scheduling • MPI library • Components • Performancemapping • Use for onlineand offlinevisualization • ParaVis tools 500 processees
Scatterplot Displays • Each pointcoordinatedeterminedby threevalues: MPI_Reduce MPI_Recv MPI_Waitsome • Min/Maxvalue range • Effective forclusteranalysis Relation between MPI_Recv and MPI_Waitsome
Online Unitah Performance Profiling • Demonstration of online profiling capability • Colliding elastic disks • Test material point method (MPM) code • Executed on 512 processors ASCI Blue Pacific at LLNL • Example • Bargraph visualization • MPI execution time • Performance mapping • Multiple time steps
Miranda Performance Analysis (Miller, LLNL) • Miranda is a research hydrodynamics code • Fortran 95, MPI • Mostly synchronous • MPI_ALLTOALL on Np x,y communicators • Some MPI reductions and broadcasts for statistics • Good communications scaling • ACL and MCR • Sibling Linux clusters • ~1000 Intel P4 nodes, dual 2.4 GHz • Up to 1728 CPUs • Fixed workload per CPU • Ported to BlueGene/L
Tau Profiling of Miranda on BG/L • Miranda team is using TAU to profile code performance • Routinely runs on BG/L for 1000 CPUs for 10-20 minutes • Scaling studies (problem size, number of processors) 128 Nodes 512 Nodes 1024 Nodes
Fine Grained Profiling via Tracing • Miranda uses TAU to generate traces • Combines MPI calls with HW counter information • Detailed code behavior to focus optimization efforts
Memory Usage Analysis • BG/L will have limited memory per node (512 MB) • Miranda uses TAU to profile memory usage • Streamlines code • Squeeze largerproblems on themachine Max Heap Memory (KB) used for 1283 problemon 16 processors of ASC Frost at LLNL
Kull Performance Optimization (Miller, LLNL) • Kull is a Lagrange hydrodynamics code • Physics packages written in C++ and Fortran • Parallel Python interpreter run-time environment! • Scalar test problem analysis • Serial execution to identify performance factors • Original code profile indicated expensive functions • CCSubzonalEffects member functions • Examination revealed optimization opportunities • Loop merging • Amortizing geometric lookup over more calculations • Apply to CSSubzonalEffects member functions
Kull Optimization • CSSubzonalEffects member functions total time • Reduced from 5.80 seconds to 0.82 seconds • Overall run time reduce from 28.1 to 22.85 seconds Original Exclusive Profile Optimized Exclusive Profile
Important Questions for Application Developers • How does performance vary with different compilers? • Is poor performance correlated with certain OS features? • Has a recent change caused unanticipated performance? • How does performance vary with MPI variants? • Why is one application version faster than another? • What is the reason for the observed scaling behavior? • Did two runs exhibit similar performance? • How are performance data related to application events? • Which machines will run my code the fastest and why? • Which benchmarks predict my code performance best?
Multi-Level Performance Data Mining • New (just forming) research project • PSU : Karen L. Karavanic • Cornell : Sally A. McKee • UO : Allen D. Malony and Sameer Shende • LLNL : John M. May and Bronis R. de Supinski • Develop performance data mining technology • Scientific applications, benchmarks, other measurements • Systematic analysis for understanding and prediction • Better foundation for evaluation of leadership-class computer systems
Goals • Answer questions at multiple levels of interest • Data from low-level measurments and simulations • use to predict application performance • data mining applied to optimize data gathering process • High-level performance data spanning dimensions • Machine, applications, code revisions • Examine broad performance trends • Need technology • Performance data instrumentation and measurement • Performance data management • Performance analysis and results presentation • Automated performance exploration
Specific Goals • Design, develop, and populate a performance database • Discover general correlations application performance and features of their external environment • Develop methods to predict application performance on lower-level metrics • Discover performance correlations between a small set of benchmarks and a collection of applications that represent a typical workload for a give system • Performance data mining infrastructure is important for all of these goals Establish a more rational basis for evaluating the performance of leadership-class computers
PerfTrack: Performance DB and Analysis Tool PSU: Kathryn Mohror, Karen Karavanic UO: Kevin Huck, Allen D. Malony LLNL: John May, Brian Miller (CASC)
Background – Ahn & Vetter, 2002 • “Scalable Analysis Techniques for Microprocessor Performance Counter Metrics,” SC2002 • Applied multivariate statistical analysis techniques to large datasets of performance data (PAPI events) • Cluster Analysis and F-Ratio • Agglomerative Hierarchical Method - dendogram identified groupings of master, slave threads in sPPM • K-means clustering and F-ratio - differences between master, slave related to communication and management • Factor Analysis • shows highly correlated metrics fall into peer groups • Combined techniques (recursively) leads to observations of application behavior hard to identify otherwise
Thread Similarity Matrix • Apply techniques from the phase analysis (Sherwood) • Threads of execution can be visually compared • Threads with abnormal behavior show up as less similar than other threads • Each thread is represented as a vector (V) of dimension n • n is the number of functions in the application V = [f1, f2, …, fn] (represent event mix) • Each value is the percentage of time spent in that function • normalized from 0.0 to 1.0 • Distance calculated between the vectors U and V: ManhattanDistance(U, V) = ∑ |ui - vi| n i=0
sPPM on Blue Horizon (64x4, OpenMP+MPI) • TAU profiles • 10 events • PerfDMF • threads 32-47
sPPM on MCR (total instructions, 16x2) • TAU/PerfDMF • 120 events • master (even) • worker (odd)
sPPM on MCR (PAPI_FP_INS, 16x2) • TAU profiles • PerfDMF • master/worker • higher/lower
sPPM on Frost (PAPI_FP_INS, 256 threads) • View of fewer than half of the threads of execution is possible on the screen at one time • Three groups are obvious: • Lower ranking threads • One unique thread • Higher ranking threads • 3% more FP • Finding subtle differences is difficult with this view
sPPM on Frost (PAPI_FP_INS, 256 threads) • Dendrogram shows 5 natural clusters: • Unique thread • High ranking master threads • Low ranking master threads • High ranking worker threads • Low ranking worker threads • TAU profiles • PerfDMF • R access threads
sPPM on MCR (PAPI_FP_INS, 16x2 threads) masters slaves
sPPM on Frost (PAPI_FP_INS, 256 threads) • After k-means clustering into 5 clusters • Similar natural clusters are grouped • Each groups performance characteristics analyzed • 256 threads of data has been reduced to 5 clusters! SPPM INTERF DIFUZE DINTERF Barrier [OpenMP:runhyd3.F <604,0>] 10 119 1 6 120
Extreme Performance Scalable Oss (ZeptoOS) • DOE, Office of Science • OS / RTS for Extreme Scale Scientific Computation • Argonne National Lab and University of Oregon • Investigate operating system and run-time (OS/R) functionality required for scalable components used in petascale architectures • Flexible OS/R functionality • Scalable OS/R system calls • Performance tools, monitoring, and metrics • Fault tolerance and resiliency • Approach • Specify OS/R requirements across scalable components • Explore flexible functionality (Linux) • Hierarchical designs optimized with collective OS/R interfaces • Integrated (horizontal, vertical) performance measurement / analysis • Fault scenarios and injection to observe behavior