Download
1 / 18
180 likes | 240 Views
Introducing Students to the Analysis of Text Data. Increase Relevance by Shifting Focus Away from Classical Statistical Mechanics & Hypothesis Testing Making Statistics More Effective in Schools of Business Mini-Conference Kellie B. Keeling

E N D
Introducing Students to the Analysis of Text Data Increase Relevance by Shifting Focus Away from Classical Statistical Mechanics & Hypothesis Testing Making Statistics More Effective in Schools of Business Mini-Conference Kellie B. Keeling Business Information & Analytics, University of Denver
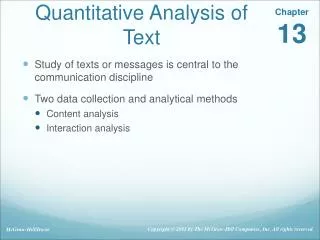
An Example of Text Analysis Twitter Data • Analyze the Tweets from Panera Bread and Compare Tweets from McDonalds and Burger King • I used this free tool to pull down tweets (uses Power Pivot): • Analytics for Twitter.xlsx • http://www.extendedresults.com/products/twitteranalytics/ • First Portion: Use Pivot Tables to Summarize Tweets from Panera Bread • Second Portion: Discuss Text Analytic terms (stop words, valence/tone) and compare dashboards of McDonalds and Burger King Tweets
Panera Tweets Data • Date/Hour/Time of Day • Author • Title (Text) • Retweet • Tweeter • Tone Score/Tone • Hashtag
Panera Tweets Data • Had them create 4 Pivot Charts from the data • Discuss what Panera Bread can learn from their Tweets based on your charts. • Goal: See how you can turn “text” data into something quantitative that can be “analyzed.
McDonalds Vs. Burger King Tweets • Goal: Discuss Text Analytic terms “stop words” and, “valence/tone” see ways this data can be displayed and interpreted.
Tone/Valence For the page with the dashboard of charts, the Tone is noted as either “Neutral”, “Positive”, or “Negative.” To rate the tweets, the Tone Dictionary on the next page was used. Using the list of sample tweets, what other words do you think should be added? POSITIVE NEGATIVE
Tone/Valence What are some words that aren’t in these tweets that you think should be added to the Tone dictionary? POSITIVE NEGATIVE
Stop Words When a computer program or software tries to determine the meaning of a “tweet,” it uses a set of “stop words” that the computer skips over when interpreting the meaning. Fill in possible Stop Words: STOP WORDS a an the
Dashboard Summary • Which company has more tweets? • What time of day does each company have the most tweets? • What can you say about the tone of the tweets over the time period? • Comment on the number of retweets versus tweets by company. • Summarize what you have learned that you could tell an executive at Burger King or McDonalds.
Conclusion • I feel this is a great way to introduce the ideas of text analysis. • Worked very well as tool to introduce text analytics to middle school girls! • I plan to create a lesson similar to this for my “Statistics II” course (probability through simple regression) starting in January.