Download
1 / 45
450 likes | 635 Views
The Nature of Stars. EXAM #3 – WILL NOT BE APRIL 5th it has been re-scheduled for THURSDAY APRIL 12th 4/12 (Wednesday) Tailgate Party!! For Exam #3 Wed April 11th Observing Logs Due IN CLASS May 1st. A star’s color reveals its surface temperature. What color is this star?. red. green.

E N D
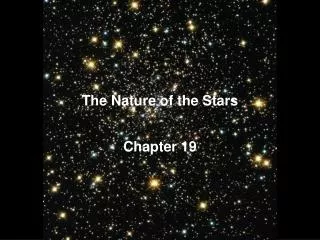
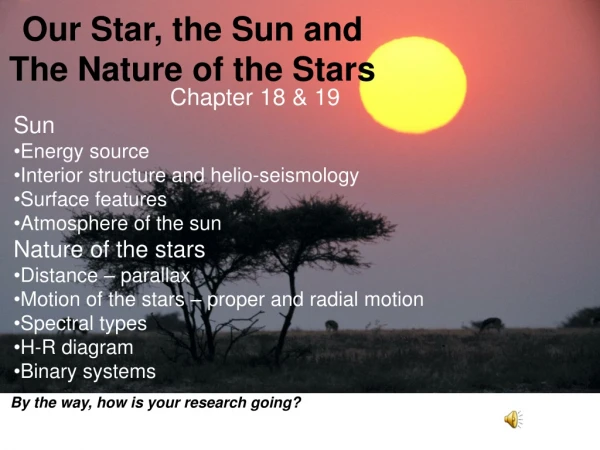
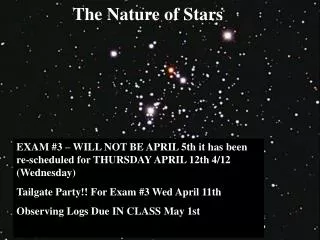
The Nature of Stars EXAM #3 – WILL NOT BE APRIL 5th it has been re-scheduled for THURSDAY APRIL 12th4/12 (Wednesday) Tailgate Party!! For Exam #3 Wed April 11th Observing Logs Due IN CLASS May 1st
A star’s color reveals its surface temperature What color is this star? red green blue
Diversity Leads to Revolution • Annie Jump Cannon • Antonia Maury • Meghnad Saha • Cecilia Payne-Gaposchkin
Classification Scheme A B C D E . . . S
Antonia Maury (1866-1952) Spectral classes might make more sense if arranged by temperature
O B A F G K M
A Revolution • Most astronomers believed that the differences in spectral lines were due to subtle differences in chemical abundance. • Indian physicist Meghnad Saha offered another explanation, which was confirmed at Harvard by Cannon and Maury’s work.
Meghnad Saha (1893-1956) Theory of thermal ionization of atoms
Cecelia Payne-Gaposchkin (1900-1979) First PhD in Astronomy from Harvard/Radcliffe
Together Saha and Payne-Gaposchkin • Gave theoretical explanation for Cannon’s classification scheme. • Showed that the differences in spectra (absorption lines) are due to temperature and thermal ionization of atoms not abundance of elements • Provided a convincing argument that stars are mostly made of hydrogen.
Stars are classified by their spectra as O, B, A, F, G, K, and M spectral types
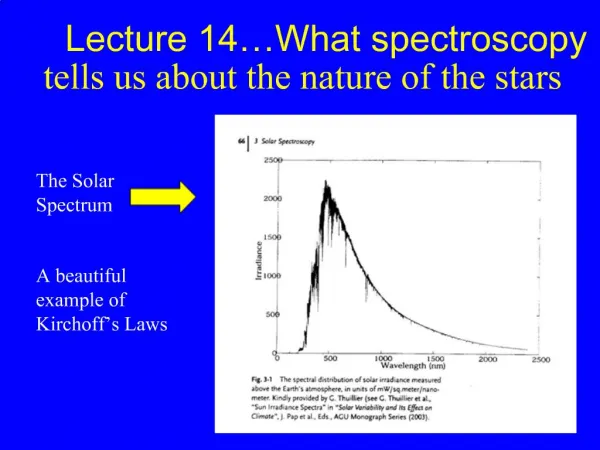
What does this give us? • a new way to classify stars • color, peak wavelength of the black body curve, and spectral class all of which are indicators of a star’s temperature
Stars are classified by their spectra as O, B, A, F, G, K, and M spectral types • O B A F G K M • hottest to coolest • bluish to reddish • An important sequence to remember: • Oh Be a Fine Guy (or Girl), Kiss Me • Overseas Broadcast - A Flash: Godzilla Kills Mothra • Over-Budget Adult Films Give Knights Merriment • One Boring Afternoon, Frank Grew Killer Marijuana
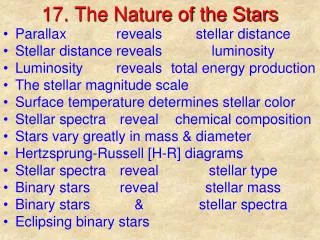
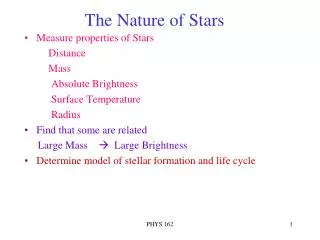
For thousands of nearby stars we can find: • the total luminosity • the temperature (color or spectral type) • the size (radius) • the distance CAN WE FIND ANY RHYME, REASON, OR RELATIONSHIPS?
Looking for correlations: Height vs. IQ ? Height vs. Weight ?
QUESTIONS: • Are more luminous stars always larger? • What combinations of temperature and luminosity are possible?
THE H-R DIAGRAM • done independently by Enjar Hertzsprung and Henry Norris Russell • graph of luminosity (or absolute magnitude) versus temperature (or spectral class)
The Hertzsprung-Russell (H-R) diagram identifies a definite relationship between temperature and absolute magnitude HR DIAGRAM absolute magnitude vs temperature or luminosity vs spectral type
The Hertzsprung-Russell (H-R) diagram identifies a definite relationship between temperature and absolute magnitude HR DIAGRAM absolute magnitude vs temperature or luminosity vs spectral type
MAIN SEQUENCE • Goes from top left (hot and bright) to bottom right (cool and dim). • 90% of the stars are in the Main Sequence stage of their lives • Includes our Sun.
Main Sequencestars are found in a band from the upper left to the lower right
RED GIANTS • Really Big, Not Very Hot but VERY BRIGHT! • Betelgeuse: 3500 K , 100,000 times more luminous than the sun • radius must be 1000x that of Sun!
Red Giant and Supergiant stars are found above and to the right of the Main Sequence stars
WHITE DWARFS • Very Small, Very Hot but Not Very Bright • Sirius B: 27,000 K, but gives off 1000 times less light than the Sun • 100 times smaller than the Sun
TinyWhite Dwarfstars are found in the lower left corner of the HR diagram
Determining the Sizes of Stars from an HR Diagram • The Smallest stars are the tiny White Dwarf stars and are found in the lower left corner of the HR diagram • Main sequence stars span a range of sizes from the small found in the lower right to the large found in the upper left • The largest stars are the Giant and Supergiant stars which are found in the upper right corner
Determining the Sizes of Stars from an HR Diagram • The Smallest stars are the tiny White Dwarf stars and are found in the lower left corner of the HR diagram • Main sequence stars span a range of sizes from the small found in the lower right to the large found in the upper left • The largest stars are the Giant and Supergiant stars which are found in the upper right corner
Tutorial: H-R Diagram (p.73) • Work with a partner! • Read the instructions and questions carefully. • Discuss the concepts and your answers with one another. Take time to understand it now!!!! • Come to a consensus answer you both agree on. • If you get stuck or are not sure of your answer, ask another group.
How does the size of a star near the top left of the H-R diagram compare with a star of the same luminosity near the top right of the H-R diagram? • They are the same size. • The star near the top left is larger. • The star near the top right is larger. • There is insufficient information to determine this. 0/0
The star Rigel is about 100,000 times brighter than the Sun and belongs to spectral type B8. The star Sirius B is about 3000 times dimmer than the Sun and also belongs to spectral type B8. Which star has the greatest surface temperature? • Rigel • Sirius B • They have the same temperature. • There is insufficient information to determine this. 0/0
Which is hotter a B3 or an A7? Which is hotter a B0 or a B9?
Which is hotter a B3 or an A7? Which is hotter a B0 or a B9?
B9 B0
What about the Masses of Stars on the H-R Diagram? • Main Sequence stars range from 0.1M to ~100M • The masses of Main Sequence stars increase with increasing luminosity, size and temperature • Main Sequence starsincrease in mass from the lower right to the upper left of the H-R Diagram
There is a relationship between mass and luminosityforMain Sequence stars Bigger (more massive) is brighter and hotter!
There is a relationship between mass and luminosityforMain Sequence starsthe numbers shown are masses in terms of the Sun’s mass Bigger (more massive) is brighter and hotter!
There is not simple relationship for the Mass of Non-Main Sequence stars: • Giants and Supergiants: range from M to about 20M • White Dwarfs: approximately M or less
Average Densities: • SUN: about density of water • GIANTS: One thousand times less dense than AIR! • DWARFS: about 1 million times the Sun’s density • one teaspoon: 5 tons!!!