Download
1 / 17
170 likes | 327 Views
Logos, Icons, and Descriptive Graphics. Cindy Taylor. Logos. Logo: a graphic representation or symbol of a company name, trademark, abbreviation, etc., often uniquely designed for ready recognition . dictionary.com

E N D
Logos, Icons, and Descriptive Graphics Cindy Taylor
Logos • Logo: a graphic representation or symbol of a company name, trademark, abbreviation, etc., often uniquely designed for ready recognition. • dictionary.com • “Logos are either purely graphic (symbols/icons) or are composed of the name of the organization...” - wikipedia.org/wiki/Log
Logos • “A logo is a graphic mark or emblem commonly used by commercial enterprises, organizations and even individuals to aid and promote instant public recognition.” - wikipedia.org/wiki/Logo
Logo Designer Paul Rand “A logo doesn’t sell, it identifies. A logo derives its meaning from the quality of the thing it symbolizes, not the other way around. A logo is less important than the product it signifies; what it means is more important than what it looks like.” “Simplicity is not the goal. It is the by-product of a good idea...” A few iconic Rand logos
Logos in Information ArchitectureUse of Logos as a universal navigation link to the Home Page - Can be integrated as an element of the menu bar or separatelyLogo colors or graphic elements can suggest stylistic cues for the rest of the site’s visual design, promoting unity of elementsFonts should also harmonize with the logo to create unity, promote readability
Logos and the Web Dynamic Logos Fluid systems of brand identity that use multiple iterations of a logo that changes at different times or under different circumstances (e.g., Google) Web 2.0 Logos Common characteristics: Soft, rounded fonts predominate Create a “cozy” look Colors are bright and cheery Blur the line between logos and icons
Caveats re: Logos for the Web Bad logo designs abound: the IA should work with graphic designers to make sure the logo is highly readable, quickly recognizable, and does not detract from content Highly detailed logos do not read well online The logo should say something about the purpose or the tone of the organization If a brand is not yet iconic, the identifying text should remain with the image on every page Raster vs. Vector Graphics: Using pixelated images is likely to lead to problems. Instead of rasterized graphics, opt for vector graphics that maintain consistency at different sizes and media.
Icons • “An icon is a small picture or symbol on a graphical user interface (GUI) that represents a program (or command), file, directory (also called a folder) or device...” • http://www.linfo.org/icon.html • “On a Web page, an icon is often a graphical image that represents the topic or information category of another Web page. Frequently, the icon is a hypertext link to that page.” • http://whatis.techtarget.com/definition/icon • The definition of logos and icons may overlap
Favicons “A favicon (short for ‘favorites icon’) is an icon associated with a website or webpage intended to be used when you bookmark the web page’. wordpress.org Web browsers use them in the URL bar, on tabs, and elsewhere to help identify a website visually. Tutorials are available on how to make your own favicons using Photoshop and other programs
Use of Icons in Information Architecture Used as navigation interfaces The search button is a very common icon Icons can be stock or can be custom designed for a website Similar to paragraph breaks in text, Icons can help visually break up the content Can represent the linked content graphically only, or combined with text Icons should be used to draw attention content. pagodabox.com
Caveats re: Icons Those relying on purely graphical representations can be confusing for users www.denisechandler.com/ Creative or ambiguous?
Caveats re: Icons Those relying on purely graphical representations can be confusing for users www.denisechandler.com Options: Provide a key for icons that may be ambiguous Label icons Use rollovers Either use conventional designs, or have a purpose for creative designs
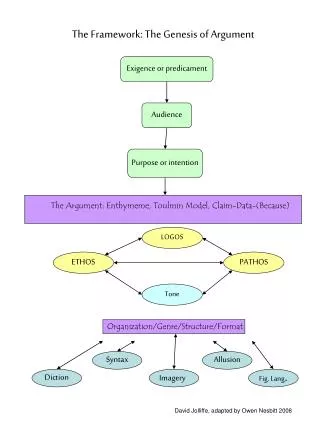
Descriptive Graphics Functions Format of a basic chart graphic AKA Information Graphics or Infographics • Represents information visually to help users understand textual and numeric data • Particularly useful for representing complex statistical information • Make the abstract concrete • May also represent spatial (maps) or temporal (timeline) information • Help users make choices and perform tasks • Breaks up blocks of textual content visually
Examples of Descriptive Graphics Area charts Bar charts Blueprints Calendars Cross sections Diagrams Flow charts Histograms Maps Pie Charts Scatter Charts Schematics Timelines Venn Diagrams
Caveats re: Descriptive Graphics Too much information… …Not enough Can confuse, rather than clarify Support with adequate labelling Understood without context Keep it simple
Descriptive Graphics inInformation Architecture The processes of IA work call for descriptive graphics extensively: Blueprints help IA professionals and clients visualize site structure and information flow Content Models can also be descriptive graphics Wireframes help IA professionals work in tandem with graphic designers and allow the client to visualize concepts Survey results are well presented graphically Timelines and Gantt Charts help keep the process on task
Resources http://logodesignerblog.com/bad-ugly-worst-logo-designs/ http://www.hexanine.com/zeroside/the-future-is-fluid-inside-dynamic-logos/ http://designshack.net/articles/layouts/vector-vs-raster-what-do-i-use/ http://www.freelancelogo.com/2010/07/25-great-examples-showing-use-of-logos-in-corporate-web-designs/ http://fontfeed.com/archives/the-logos-of-web-20/ http://webdesignledger.com/inspiration/21-inspiring-examples-of-icons-in-web-design http://www.photoshopsupport.com/tutorials/jennifer/favicon.html http://www.businessinsider.com/infographics-must-die-2013-6