Download
1 / 21
210 likes | 346 Views
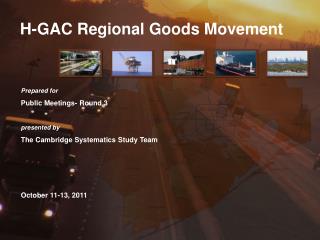
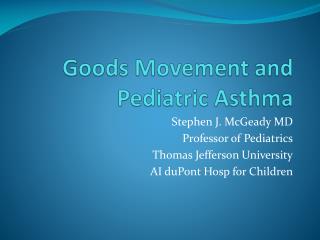
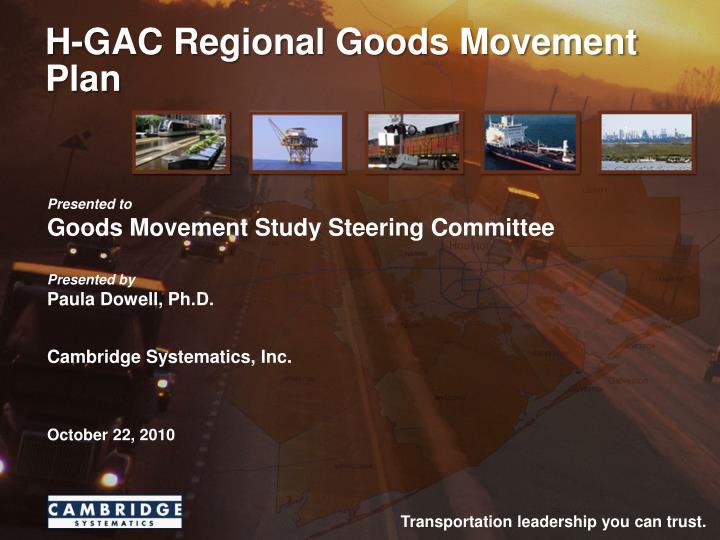
H-GAC Regional Goods Movement Plan. Presented to Goods Movement Study Steering Committee Presented by Paula Dowell, Ph.D. Cambridge Systematics, Inc . October 22, 2010. Transportation leadership you can trust. H-GAC Regional Goods Movement Study.

E N D
H-GAC Regional Goods Movement Plan Presented toGoods Movement Study Steering Committee Presented byPaula Dowell, Ph.D. Cambridge Systematics, Inc. October 22, 2010 Transportation leadership you can trust.
H-GAC Regional Goods Movement Study • Purpose – Promote economic competitiveness by enhancing efficient movement of goods and freight while mitigating community impacts • Multimodal study with focus on highways and truck movements and impacts • Final Regional Goods Movement Plan in Spring 2012
Technical Analysis • Freight profiles • Economic structure and logistics patterns • Modal profiles • Commodity flow profile • Freight analysis and modeling • Freight subsystem identification • Forecasting and modeling • Needs and deficiencies • Physical and operational bottleneck analysis • Financial and institutional constraints
Recommendation Development and Screening • Develop multimodal solution packages • Evaluation and prioritization • Performance measures • Funding and financing strategies • RTP development and implementation plan
Outcomes Solutions • Access to industry and modal stakeholders • Linking economic structure to transportation needs • Screening process of identification of subsystem Regional Consensus • Building stakeholder and community buy-in • Steering committee Funding and Implementation • Freight investment BC and prioritization • Funding strategy and public-private partnerships • Realistic plan with implementation strategy
Why is this Important? • Economic competitiveness and growth • Availability and prices of consumer goods • Congestion and delay • Air quality • Safety • Pavement costs and conditions • Other community impacts
Houston-Galveston RegionWhat is Driving Growth in Goods Movement? • Growth in own market • Import and export • Manufacturing and consumer goods • Expand market reach for inland trade • Midwest • Southwest
Growth in Own Market • 2007-2035 (Woods & Poole) • Population growth – 47% • Employment growth – 55% • Drives demand for freight and goods
Growth in Freight Intensive Sectors Construction Manufacturing Wholesale Retail T&W
U.S. Container Traffic by Coast (PIERS) TEU (in Millions) 35 Gulf Coast – 8% of trade 30 25 20 West Coast – 49% of trade 15 10 5 East Coast accounts for 43% of U.S. trade 0 1993 1995 1997 1999 2001 2003 2005 2007 2009 1994 1996 1998 2000 2002 2004 2006 2008 2010 East Coast West Coast Gulf Coast
The Canal Effect on Container Trade 5-Year Compound Annual TEU Growth Rates, Imports from Asia 7.7% East Coast 4.5% 4.8% “The changes we are seeing in patterns of trade are fundamental… the West Coast ports are unlikely to go into long term decline … we do expect up to 25% of the West Coast ports’ present import cargo base could be lost to the East and Gulf ports in the decade to come” Drewry, September 2008 5.1% West Coast 2.9% 3.8% 2% 0% 4% 6% 8% 10% 2003-2008 2008-2013 2013-2018 Note: Gulf coast imports from Asia (’13-’18) expected to grow 8.2%. Source: RK Johns Forecast.
How Much Freight is Moving in Region? Projected Growth in Region’s Freight Volumes Ton (in Thousands) 1,400,000 1,200,000 1,000,000 800,000 600,000 400,000 200,000 0 2035 2007 Source: IHS Global Insight., does not include pipeline volumes
How is Freight Moving in the Region? Mode Share of Freight Movements (in Tons) 2007 Source: IHS Global Insight, Inc.
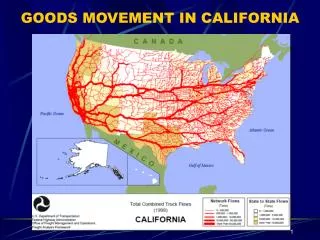
How Many Trucks Will be on the Highways? High Volume Truck Corridors, 2035 Source: Cambridge Systematics mapping of TranSearch, IHS Global Insight, Inc.
Where is Freight Moving in Region? Directional Flow of Freight and Goods (in Tons)2007 Source: IHS Global Insight, Inc.
Where Is the Freight Moving To and From? Source: Cambridge Systematics analysis of TranSearch, IHS Global Insight, Inc.
Regional Challenges to Meeting Increased Demand • Highways • Congestion/delay • Heavy loads • State of repair • Railroads • Line and yard capacity • Other priorities • Pressure for passenger service • Air quality/environmental impacts • Community conflicts • Safety
How Many Highway Crashes Involve Trucks? 140,000 120,000 100,000 80,000 60,000 40,000 20,000 0 2003 2004 2005 2006 2007 Other Crashes Truck-Involved Crashes Source: Data from H-GAC Report, State of Safety in the Region: 2009.
Air Quality Impacts Source: NHI 139005 Linking Freight to the Environment and Planning
What we need from you: • Dialogue about trade-offs between benefits and costs • Discussion of alternative strategies • Decision making framework • Foundation for partnerships going forward
Discussion • What are you looking to get from this study? What does a successful study mean to you? • How does the region position to compete in the future? • Accommodate regional (organic) growth • Position for more of a national trade gateway • Where is growth going to happen and is that where you want it to happen? How can we prepare for that growth? • How do you plan for and manage shared usage of infrastructure?