
Unraveling Solar Radio Event of Jan 17, 2005: A Complex Phenomenon
Study of dual flares and CMEs reveals evolving magnetic configurations, accelerated electrons, and shock wave interactions in solar corona. Insights into solar energetic particle acceleration mechanisms are provided.

Unraveling Solar Radio Event of Jan 17, 2005: A Complex Phenomenon
E N D
Presentation Transcript
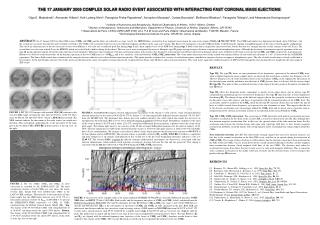
THE 17 JANUARY 2005 COMPLEX SOLAR RADIO EVENT ASSOCIATED WITH INTERACTING FAST CORONAL MASS EJECTIONSOlga E. Malandraki1, Alexander Hillaris2, Karl-Ludwig Klein3, Panagiota Preka-Papadema2, Xenophon Moussas2, Costas Bouratzis2, Eleftheria Mitsakou2, Panagiotis Tsitsipis4, and Athanassios Kontogeorgos41 Institute of Astronomy and Astrophysics, National Observatory of Athens, 11810- Athens, Greece 2 Section of Astrophysics, Astronomy and Mechanics, Department of Physics, University of Athens, Zografos- Athens, GR-15783 3 Observatoire de Paris, LESIA-CNRS UMR 8109, Univ. P & M Curie and Paris-Diderot, Observatoire de Meudon, F-92195, Meudon, France 4Technological Educational Institute of Lamia, GR-35100, Lamia, Greece ABSTRACT:On 17 January 2005 two flare/CME events (CME1 and CME2 and the flares are referred to as stage 1 and 2 of a 3B/X3.8 flare), occurred in close temporal succession in the same active region (NOAA AR 720, N15◦ W25◦). The CMEs had similar very high projected speed, above 2000 km/ s, but the second one was faster than the first and eventually overtook it. The CMEs were associated with two successive filament eruptions and flares in the same active region. The flares were contiguous so that the CMEs probably resulted from the eruption of neighboring parts of the same overall magnetic configuration. The soft X-ray characteristics of the two successive events were different: a very slow rise to moderate peak flux during stage 1 and a more impulsive rise to the X3.8 level during stage 2. Both events had a conspicuous microwave burst, but the first one was stronger than the second, contrary to the soft X-rays. The second burst was also seen in hard X-rays by RHESSI, which was in the Earth’s shadow during the first burst. The two events were accompanied by metre-to-kilometre type-III groups tracing energetic electrons escaping into the interplanetary space. Although the decametre-to-hectometre spectral signatures of the two type-III groups appeared similar, the metric radio emission reveals distinctive differences that corroborate evolving acceleration regions in the corona. Two decametre-to-hectometre type-II bursts detected on dynamic spectra were attributed to the shock waves driven by CME1 and CME2 respectively. A peculiar type-III burst was observed at the intersection, on the dynamic spectrum, of the two CME fronts (at ≈ 38 RSUN) and it was, therefore, associated with the CME1-CME2 interaction. The events under discussion were clearly related with enhanced fluxes of near-relativistic electrons at 1 AU, as observed by the ACE/EPAM experiment. The Sun to Earth transit-time estimation of the energetic electrons indicates two or three distinct injection episodes. This report provides evidence that a variety of acceleration regions contribute to energetic electrons escaping to interplanetary space. The role of shock acceleration is clearly established at low energies, by the type II radio emission. Our results favour acceleration in the course of magnetic reconnection for the escaping electron beams (type III bursts and in situ measurements). This work shows again that combined analyses of SEP and electromagnetic emission provide new insight into the solar origin of SEP events. RESULTS Type III1: The type III1bursts are most prominent at low frequencies, upstream of the inferred CME1front, while at higher frequencies more complex bursts are observed that mostly have a distinct low-frequency cut off. The low-frequency cut off of the decimetric bursts in the early phase of III1 can be explained by interactions of the electron beams with the turbulence near the front of CME1 because there is a distinct lack of (reverse-slope) RS type IIIs. This point to flare-accelerated electrons at the origin of the first group of decametric-to-kilometric type III bursts. Type III2: Here the decimetric-metric counterpart is mostly reverse-slope bursts and an intense type IV continuum that gradually progresses toward lower frequencies. The type III emission starts at lower frequencies than during III1. The change of sign of the drift rate suggests that in this group the accelerator is located above the dm-metre wave radio sources, and this is in agreement with the estimated position of the CME2 front. The acceleration could be ascribed to the CME2 shock but the type IV emission clearly does not follow the type II burst as it drifts towards lower frequency, yet it persists for tens of minutes or more. This suggests that the site of the electron acceleration stays increasingly behind the CME2 front and its shock, and is consistent with an interpretation of the electron acceleration in terms of reconnection in the corona behind the CME2. Type III3 CME1-CME2 interaction: The association of CME interaction with particle acceleration has been ascribed to acceleration by the shock of the second CME as it traverses the previous one ([5], [6]), although they also mention magnetic reconnection. But, in this case, the spectral nature of the radio emission shows that the accelerator must release the electron beams onto open solar wind-type field lines it, thus, favours magnetic reconnection, probably, in sheath regions with strong magnetic fields of interplanetary origin, draped around the CMEs. Near-relativistic electrons at 1 AU: The observations strongly suggest that successive intensity increases are first due to the coronal acceleration in the flare/CME event, and then to an episode during the interaction of CME1-CME2. The escape of these electrons to ACE confirms that the electrons cannot have been accelerated in the body of the first CME, even if a shock driven by the second one passed through it. Neither can they originate from reconnection between closed magnetic field lines of the two CMEs. The electrons must rather be accelerated in regions from where they have ready access to solar wind magnetic field lines. This is consistent with a common acceleration of the mildly relativistic electrons and the electron beams at lower energies that produce the type III emission. REFRENCES [1] Bougeret, J.L., Kaiser,M.L., Kellogg, et al. : 1995, Space Sci. Rev.71, 231. [2] Brueckner, G.E., Howard, R.A., Koomen, et al.: 1995, Solar Phys. 162, 357. [3] Caroubalos, C., Maroulis, D., Patavalis, et al.: 2001, Exp. Astron. 11, 23. [4] Gold, R.E., Krimigis, S.M., Hawkins et al.: 1998, Space Sci. Rev. 86, 541. [5] Gopalswamy, N., Yashiro, S., Kaiser, et al.: 2001, Astrophys. J. Lett. 548, L91. [6] Gopalswamy, N., Yashiro, S., Kaiser, et al.: 2002, Geophys. Res. Lett. 29, 080000. [7] Guidice D.A., Cliver E.W., Barron W.R., Kahler S.: 1981, Bull. Amer. Astron. Soc., 13, 553. [8] Kontogeorgos, A., Tsitsipis, P., Caroubalos et al.: 2006, Exp. Astron. 21, 41. [9] Delaboudiniere, J.P., Artzner, G.E., Brunaud et al.: 1995, Solar Phys. 162, 291. [10] Kerdraon A., Delouis J.M.: 1997, In: Trottet, G. (ed.) Coronal Phys. from Radio and Space Observations, Berlin Springer Verlag, Lecture Notes in Phys., 483,192 [11] Papaioannou, A., Malandraki, O., Belov, A., et al.: 2010, Solar Phys. 266, 181. [12] Vrsnak, B., Magdalenic, J., Zlobec, P.: 2004, Astron. Astrophys. 413, 753. FIGURE 4: ACE/EPAM [4] energetic electron enhancements in response to the January 17 solar activity. 1-min averaged deflected electron intensities for the interval 04:00-20:00 UT on January 17 of four magnetically deflected electron channels (38-315 keV) from the EPAM/CA60. The horizontal lines denote pre-event ambient intensity; the solid vertical line marks the arrival of an interplanetary forward shock (FS) at 07:12 UT at ACE [11]. Inserts a and b present Pitch-Angle Distributions snapshots at the onset of the event at about 11:00 UT and at about 12:10 UT; normalized differential electron intensity is plotted versus the cosine of the pitch angle. The bottom right insert is an overview of the 20-min averaged differential intensities for the interval January 15-20, 2005. The first significant rise (>2σ) of the electron intensities occurs at 10:00 UT (The spiky increase at about 10:40 UT is probably due to X-ray contamination). We estimate a travel time of about 15 min, which indicates the electrons were released at ≈09:45 UT at the Sun (photon arrival at 09:53 UT). This electron release is, probably, related to III1 and III2 (FIGURE 3). Follows a significant and more abrupt rise at all energies. Extrapolation of this second rise to the pre-event background intensities indicates a start at ≈ 12:00 UT. The electron PADs (snapshot b) indicate stronger unidirectional anisotropies are observed in association with this electron enhancement, which indicate fresh injection of energetic electrons between the Sun and the spacecraft. This timing is consistent with the III3 burst observed at ≈ 11:37 UT during the CME1-CME2 interaction. FIGURE 1: EIT [9] 195 Ǻ images with overlaid NRH [10] contours in the 164-432 MHz range covering the time interval 09:00 to 10:00 UT. They show the NOAA 720 AR (N15o W25 o) where a 3B/X3.8 flare occured. The NRH contours indicate the movement of the radio sources in a north-west direction. This corresponds, approximately, to the movement of the main part of the two Halo CMEs (FIGURE 2).Solar north is at the top, west on the right. FIGURE 2: The two CMEs (CME1 and CME2) in close succession as recorded by the SOHO/LASCO [2]. The most conspicuous features of both CMEs are seen above the north-western limb, though both were labelled halo CMEs in the LASCO CME catalogue. The linear fits to the trajectories of their fronts imply that the CME fronts intersect near 12:32 UT at a heliocentric distance of about 38 RSUN. In FIGURE 3 we present the FREQUENCY-TIME trajectories of CME1 & CME2 calculated from the Hybrid Coronal density Model [12]. Top: Two frames of the 09:30:05 Halo CME1 with extrapolated lift of at 09:00:47 and plane-of-the-sky speed 2094 km/sec. Bottom: Two frames of the 09:54:05 Halo CME2 with extrapolated lift of at 09:38:25 and plane-of-the-sky speed 2547 km/sec. Solar north is at the top, west on the right. FIGURE 3: An overview of the complex radio event using combined ARTEMIS-IV/Wind/Waves ([1], [3]) differential spectrum, GOES SXR (blue) and RSTN [7] flux 15400 MHz (Red) profile and the frequency-time plots of CME1 and CME2 (black) calculated from the Hybrid Coronal density Model [12]. The type IV continuum, the type III GG bursts (III1and III2), the stages 1 and 2 of the SXR flux rise, and the type III like burst (III3) at the convergence of the fronts of CME1 and CME2 are duly annotated on the plot. Both SXR and microwave time histories indicate two successive events of energy release. GOES reports an X3.8 SXR flare from 06:59 UT to 10:07 UT; it starts with a smooth increase until 09:05, followed by a slightly faster (stage 1) until 09:45 and an even faster rise (stage 2) until the peak. The gradual rise in stage 1 and the faster rise in stage 2 were each accompanied by strong microwave bursts. The type II bursts (II1and II2) are aligned with the inferred frequency-time trajectory of the fronts of CME1 and CME2, therefore ascribe them to their respective bow shocks of the CMEs. The two type III groups occurred near the extrapolated lift off times of the two CMEs.


