Download
1 / 83
830 likes | 1.2k Views
Hall of Fame or Hall of Shame?. java.sun.com. Hall of Fame. Good branding java logo value prop Inverse pyramid writing style Fresh content changing first read news in sidebar Obvious Links . Evaluation Outline. Lab-based user testing Discount usability

E N D
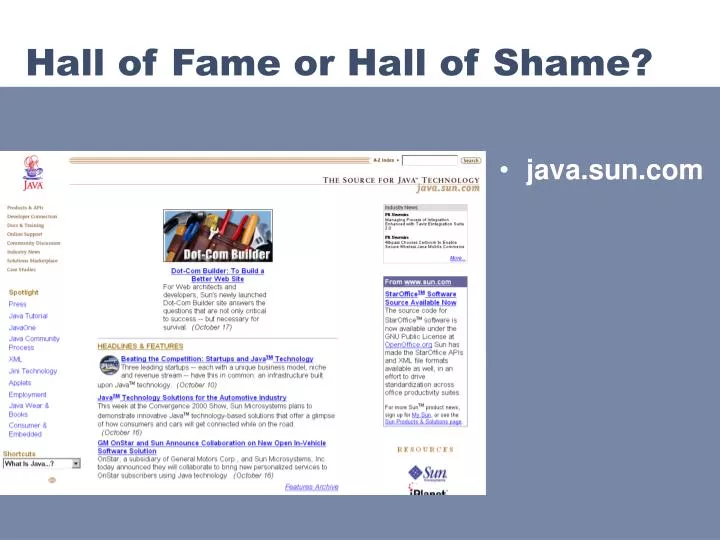
Hall of Fame or Hall of Shame? • java.sun.com
Hall of Fame • Good branding • java logo • value prop • Inverse pyramid writing style • Fresh content • changing first read • news in sidebar • Obvious Links
Evaluation Outline • Lab-based user testing • Discount usability • Remote / Online user testing • Action analysis • Heuristic evaluation
Why do User Testing? • Can’t tell how good UI is until? • people use it! • Other methods are based on evaluators who • may know too much • may not know enough (about tasks, etc.) • Hard to predict what real users will do
Choosing Participants • Representative of target users • job-specific vocab / knowledge • tasks • Approximate if needed • system intended for doctors • get medical students • system intended for engineers • get engineering students • Use incentives to get participants
Ethical Considerations • Sometimes tests can be distressing • users have left in tears • You have a responsibility to alleviate • make voluntary with informed consent • avoid pressure to participate • let them know they can stop at any time • stress that you are testing the system, not them • make collected data as anonymous as possible • Often must get human subjects approval
User Test Proposal • A report that contains • objective • description of system being testing • task environment & materials • participants • methodology • tasks • test measures • Get approved & then reuse for final report • Seems tedious, but writing this will help “debug” your test
Selecting Tasks • Should reflect what real tasks will be like • Tasks from analysis & design can be used • may need to shorten if • they take too long • require background that test user won’t have • Try not to train unless that will happen in real deployment • Avoid bending tasks in direction of what your design best supports • Don’t choose tasks that are too fragmented • e.g., phone-in bank test
Deciding on Data to Collect • Two types of data • process data • observations of what users are doing & thinking • bottom-line data • summary of what happened (time, errors, success) • i.e., the dependent variables
Which Type of Data to Collect? • Focus on process data first • gives good overview of where problems are • Bottom-line doesn’t tell you where to fix • just says: “too slow”, “too many errors”, etc. • Hard to get reliable bottom-line results • need many users for statistical significance
The “Thinking Aloud” Method • Need to know what users are thinking, not just what they are doing • Ask users to talk while performing tasks • tell us what they are thinking • tell us what they are trying to do • tell us questions that arise as they work • tell us things they read • Make a recording or take good notes • make sure you can tell what they were doing
Thinking Aloud (cont.) • Prompt the user to keep talking • “tell me what you are thinking” • Only help on things you have pre-decided • keep track of anything you do give help on • Recording • use a digital watch/clock • take notes, plus if possible • record audio and video (or even event logs)
Using the Test Results • Summarize the data • make a list of all critical incidents (CI) • positive & negative • include references back to original data • try to judge why each difficulty occurred • What does data tell you? • UI work the way you thought it would? • users take approaches you expected? • something missing?
Using the Results (cont.) • Update task analysis & rethink design • rate severity & ease of fixing CIs • fix both severe problems & make the easy fixes • Will thinking aloud give the right answers? • not always • if you ask a question, people will always give an answer, even it is has nothing to do with facts • panty hose example • try to avoid specific questions
Measuring Bottom-Line Usability • Situations in which numbers are useful • time requirements for task completion • successful task completion • compare two designs on speed or # of errors • Ease of measurement • time is easy to record • error or successful completion is harder • define in advance what these mean • Do not combine with thinking-aloud. Why? • talking can affect speed & accuracy
Analyzing the Numbers • Example: trying to get task time <=30 min. • test gives: 20, 15, 40, 90, 10, 5 • mean (average) = 30 • median (middle) = 17.5 • looks good! • wrong answer, not certain of anything • Factors contributing to our uncertainty • small number of test users (n = 6) • results are very variable (standard deviation = 32) • std. dev. measures dispersal from the mean
Analyzing the Numbers (cont.) • This is what statistics is for • Crank through the procedures and you find • 95% certain that typical value is between 5 & 55 • Usability test data is quite variable • need lots to get good estimates of typical values • 4 times as many tests will only narrow range by 2x • breadth of range depends on sqrt of # of test users • this is when online methods become useful • easy to test w/ large numbers of users
Measuring User Preference • How much users like or dislike the system • can ask them to rate on a scale of 1 to 10 • or have them choose among statements • “best UI I’ve ever…”, “better than average”… • hard to be sure what data will mean • novelty of UI, feelings, not realistic setting … • If many give you low ratings -> trouble • Can get some useful data by asking • what they liked, disliked, where they had trouble, best part, worst part, etc. (redundant questions are OK)
B A Comparing Two Alternatives • Between groups experiment • two groups of test users • each group uses only 1 of the systems • Within groups experiment • one group of test users • each person uses both systems • can’t use the same tasks or order (learning) • best for low-level interaction techniques • Between groups requires many more participants than within groups • See if differences are statistically significant • assumes normal distribution & same std. dev.
Reporting the Results • Report what you did & what happened • Images & graphs help people get it! • Video clips can be quite convincing
Discount Usability Engineering • Reaction to excuses for not doing user testing • “too expensive”, “takes too long”, … • Cheap • no special labs or equipment needed • the more careful you are, the better it gets • Fast • on order of 1 day to apply • standard usability testing may take a week or more • Easy to use • some techniques can be taught in 2-4 hours
Examples of Discount Usability • Walkthroughs • put yourself in the shoes of a user • like a code walkthrough • Low-fi prototyping • Action analysis (GOMS) • On-line, remote usability tests • Heuristic evaluation
Action Analysis & GOMS • Predicts performance on goals & tasks using a cognitive model • GOMS is a popular family of UI modeling techniques • based on Model Human Processor • GOMS stands for • Goals • Operators • Methods • Selection rules • Input: detailed description of UI/task(s) • list steps hierarchically • Output: qualitative & quantitative measures
Quick Example • Goal (the big picture) • go from hotel to the airport • Methods (or subgoals)? • walk, take bus, take taxi, rent car, take train • Operators (or specific actions) • locate bus stop; wait for bus; get on the bus;... • Selection rules (choosing among methods)? • Example: Walking is cheaper, but tiring and slow • Example: Taking a bus is complicated abroad
GOMS Output • Execution time • add up times from operators • assumes experts (mastered the tasks) • error free behavior • very good rank ordering • absolute accuracy ~10-20% • Procedure learning time (NGOMSL only) • accurate for relative comparison only • doesn’t include time for learning domain knowledge
Using GOMS Output • Ensure frequent goals achieved quickly • Making hierarchy is often the value • functionality coverage & consistency • does UI contain needed functions? • consistency: are similar tasks performed similarly? • operator sequence • in what order are individual operations done?
Comparative Example - DOS • Goal: Delete a File • Method for accomplishing goal of deleting a file • retrieve from Long term memory that command verb is “del” • think of directory name & file name and make it the first listed parameter • accomplish goal of entering & executing command • return with goal accomplished
Comparative Example - Mac • Goal: Delete a File • Method for accomplishing goal of deleting a file • find file icon • accomplish goal of dragging file to trash • Return with goal accomplished
Applications of GOMS • Compare different UI designs • Profiling (time) • Building a help system • modeling makes user tasks & goals explicit • can suggest questions users will ask & the answers
Tradeoffs of Using GOMS • Advantages • gives qualitative & quantitative measures • less work than user study • easy to modify when UI is revised • Disadvantages • takes lots of time, skill, & effort • research: tools to aid modeling process • only works for goal-directed tasks • not problem solving or creative tasks (design) • assumes tasks performed by expertsw/oerror • does not address several UI issues, • readability, memorability of icons, commands
Online, Remote Usability Testing • Use web to carry out usability evaluations • Two main approaches • agent-based evaluation (e.g., WebCritera) • model automatically evaluates UI (web site) • WebCritiera uses a modified GOMS model • remote usability testing (e.g., NetRaker & Vividence) • combines usability testing + market research techniques • automatic logging & some analysis of usage
Max – WebCriteria’s Agent • Predicts how long information seeking tasks would take on a web site • Automated procedure: • seed with start page & goal page • procedure • reads page • model predicts how long to find & click proper link load time, scan time, & mouse movement time • repeat until find goal page • Claim: time is directly related to usability
Tradeoffs of Max-style Model • Advantages • very inexpensive (no participants needed) • fast turnaround (hours) • can run on many sites & compare -> benchmarks • Disadvantages • focus on time (much of it download time) • only 3rd in important factors driving repeat web visits • can’t tell you anything about your content • doesn’t say anything directly about usability problems • robots aren’t humans • doesn’t make mistakes • remember, GOMS assumes expert behavior! • doesn’t account for understanding text • only tries the best path – users will use many • major flaw is the lack of real users in the process
Remote Usability Testing • Move usability testing online • research participants access “lab” via web • answer questions & complete tasks in “survey” • system records actions or screens for playback • can test many users & tasks -> good coverage • Analyze data in aggregate or individually • find general problem areas • use average task times or completion rates • playback individual sessions • focus on problems w/ traditional usability testing
Warning I am a founder of the following company – watch for bias!
NetRaker: Web Experience Evaluation • NetRaker Index • short pop-up survey shown to 1 in n visitors • on-going tracking & evaluation data • Market Research & Usability Templates • surveys & task testing • records clickstreams as well • invite delivered through email, links, or pop-ups • NetRaker Experience Recording • captures “video” of remote participants screen • indexed by survey data or task performance
NetRaker Index: On-going customer intelligence gathering • Small number of rotated questions increases response rate
NetRaker Index: On-going customer intelligence gathering • Small number of rotated questions increases response rate
NetRaker Index: On-going customer intelligence gathering • Increasing these indices (e.g., retention) moderately (5%) leads to a large increase in revenue growth
NetRaker Usability Research:See how customers accomplish real tasks on site
NetRaker Usability Research:See how customers accomplish real tasks on site
NetRaker Usability Research:See how customers accomplish real tasks on site
Advantages of Remote Usability Testing • Fast • can set up research in 3-4 hours • get results in 24 hours • More accurate • can run with large sample sizes • 50-200 users -> reliable bottom-line data (stat. sig.) • uses real people (customers) performing tasks • natural environment (home/work/machine) • Easy-to-use • templates make setting up easy for non-specialists • Can compare with competitors • indexed to national norms
Disadvantages of Remote Usability • Miss observational feedback • facial expressions • verbal feedback (critical incidents) • Need to involve human participants • costs money (typically $20-$50/person) • People often do not like pop-ups • need to be careful when using them
Heuristic Evaluation • Developed by Jakob Nielsen • Helps find usability problems in a UI design • Small set (3-5) of evaluators examine UI • independently check for compliance with usability principles (“heuristics”) • different evaluators will find different problems • evaluators only communicate afterwards • findings are then aggregated • Can perform on working UI or on sketches
Why Multiple Evaluators? • Every evaluator doesn’t find every problem • Good evaluators find both easy & hard ones
Heuristic Evaluation Process • Evaluators go through UI several times • inspect various dialogue elements • compare with list of usability principles • consider other principles/results that come to mind • Usability principles • Nielsen’s “heuristics” • supplementary list of category-specific heuristics • competitive analysis & user testing of existing products • Use violations to redesign/fix problems
H1-1: Simple & natural dialog H1-2: Speak the users’ language H1-3: Minimize users’ memory load H1-4: Consistency H1-5: Feedback H1-6: Clearly marked exits H1-7: Shortcuts H1-8: Precise & constructive error messages H1-9: Prevent errors H1-10: Help and documentation Heuristics (original)
searching database for matches Heuristics (revised set) • H2-1: Visibility of system status • keep users informed about what is going on • example: pay attention to response time • 0.1 sec: no special indicators needed, why? • 1.0 sec: user tends to lose track of data • 10 sec: max. duration if user to stay focused on action • for longer delays, use percent-done progress bars