Download
1 / 2
30 likes | 272 Views
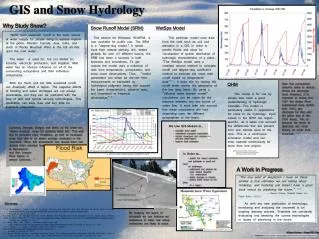
Why Study Snow?. Snow Runoff Model (SRM) WetSpa Model.

E N D
Why Study Snow? Snow Runoff Model (SRM)WetSpa Model Water from snowmelt runoff is the main source of water supply for people living in various regions of the globe. Western Canada, Asia, India, and much of Rocky Mountain West in the US all rely upon the melt water. The water is used for, but not limited to: industry, electricity production, and irrigation. Melt water has an obvious influence on all of the surrounding ecosystems and their individual components. Both too much and too little snowmelt runoff can drastically affect a region. The negative effects of flooding and water shortages are not always preventable, but they can be predicted with the help of GIS and remote sensing technologies. This application can save lives and buy time for important preparation. The version for Windows, WinSRM, is now available for public use. The SRM is a “degree-day model.” It needs input from remote sensing unit. tested globally for over 60 different basins, the SRM has been a success in both forecasts and simulations. To get outputs the model uses a collection of data from temperature, precipitation, and snow cover observations. Thus, “model parameters can either be derived from measurements or estimated by hydrological judgment taking into account the basin characteristics, physical laws, and theoretical or empirical relationships”(4). This particular model uses data from the land such as soil and elevation in a GIS in order to predict floods and allow for visualization of spatial distribution of hydrologic characteristics of a place. “The WetSpa model uses a modified rational method to calculate runoff and degree-day coefficient method to estimate the snow melt runoff based on temperature data”(1). It does this by routing the runoff water across the geography of the low lying basin. By using a “diffusive wave transfer model” calculations can be made for the distance between any two points of water flow. It must take into account that these calculations will vary depending upon the different geographies of the basin. GIS and Snow Hydrology Note that precipitation amounts seem to directly dictate the discharge level. However, it is important to realize that 1997 the Snake River experienced more rainfall than 1996; yet, discharge for that year fell below that of the 1996 levels. This is because the levels of discharge rely more heavily on water from snowmelt.(3) QHM This model is for use by people who have a good understanding of hydrologic concepts. This model is particularly useful in applications for snow or ice hydrology. Input values in the QHM are region specific, as it takes into account the differences that are present from one climate zone to the next. This is a continuous simulation model and caneven operate continuously for more than one project. We Use GIS Models to… - calculate snow depth - understand snowpack composition - monitor snowcover and compare to previous observations - improve flood protection California, Nevada, Oregon and Idaho all fell under the ‘Above Average’ range for potential flood risk. This was due to persistent rainy conditions, as well as increased snow melt due to an above average snowpack in the mountains. When this assessment was issued there had already been reported floodingin Sacramento and San JoaquinRiver basins in central California.(5) In Order to…- predict the impact sediments and pollutants in runoff will have on waterways - understand and prepare for snow related disasters (i.e. avalanches) - detect changes in climate - predict future stress on the biota of a region A Work In Progress "The one word of skepticism I have on these studies is that ultimately we are talking about modeling, and modeling just doesn't have a good track record for predicting the future.”(2) – Bonner Cohen, National Centerfor Public Policy (2005) As with any new application of technology, monitoring and analyzing the snowmelt is an ongoing learning process. Scientists are constantly evaluating and tweaking the current technologies in hopes of advancing in the future. By studying the layers of snowpack we can improve our predictions of when and where avalanches are likely to occur. Sources: 1.) A. Bahremand, J. Corluy, Y. Liu, F. De Smedt, J.Poorova, and L.Velcická. River Flow Simulation By WetSpa Model in Hornad Watershed,Slovakia.www.astro.oma.be/BNCGG/contactforum10_05/abstract-contrib/abstract14.doc. Accessed on January 25, 2007. 2.) Hall, Carl T. San Francisco Chronicle. Global Warming Study Forecasts More Water Shortages; Climate Change Already Affecting Sierra Snowpack. November 17, 2005. http://www.sfgate.com/cgibin/article.cgi?f=/c/a/2005/11/17/MNG4EFPHK51.DTL&type=science.Accessed on January 22, 2007.3.) Lamar. Mike. Term Project - Snowpack Analysis Using GIS. http://www.crwr.utexas.edu/gis/gishydro01/Class/trmproj/lamar/termproject.html. Accessed on January 24, 2007.4.) J. Martinec . A. Rango, R. Roberts. SRM User’s Manual (Abstract). http://hydrolab.arsusda.gov/~rroberts/srmmanual/srmman.html. Accessed on January 22, 2007.5.) National Weather Service - Hydrologic Information Center. 2006 National Hydrologic Assessment. Elevated Flood Risk in Parts of West and Mid-West. April 14, 2006. http://www.nws.noaa.gov/oh/hic/nho/. Accessed on January 25, 2007. Allison Hurley – Geog 363: Section 006