Download
1 / 1
10 likes | 130 Views
This study investigates the impact of utilizing satellite observations, specifically OMI ozone profiles, for improving air quality forecasts. By integrating data from OMI with CMAQ modeling, we evaluate the influence of satellite-derived information on NOx and ozone simulations. The analysis covers the incorporation of MODIS aerosol data and the role of lightning-generated emissions in shaping tropospheric pollutants. Results indicate enhanced accuracy in mid and upper-tropospheric ozone calculations, showcasing the value of satellite assimilation in air quality predictions.

E N D
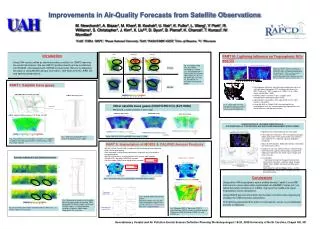
cntrl raqms_bc sat_bc (1) (2) (3) (a) (b) (c) (d) 212 mb Elemental carbon mass 853 mb Anthropogenic organic mass Improvements in Air-Quality Forecasts from Satellite Observations M. Newchurch1, A. Biazar1, M. Khan2, B. Koshak3, U. Nair1, K. Fuller1, L. Wang1, Y. Park1, R. Williams1, S. Christopher1, J. Kim4, X. Liu5,6, D. Byun7, B. Pierce8, K. Chance5, T. Kurosu5, W. Mcmillan6 1UAH, 2USRA, 3MSFC, 4Pusan National University, 5SAO, 6NASA/UMBC-GEST, 7Univ. of Houston, 8U. Wisconsin Introduction Using OMI ozone profiles as lateral boundary condition for CMAQ improves the model calculations. We use OMI O3 profiles directly and as assimilated into RAQMS, all evaluated with IONS06 ozonesondes. We are investigating the value of using MODIS aerosol information, OMI NO2 & HCHO, AIRS CO, and lightning observations. PART III: Lightning Influence on Tropospheric NOx and O3 Fig. 5 O3 (ppbv) 1900 UTC, 8/21/2006 simulated by 3 CMAQ runs; over plotted with 9 ozonesondes found within 1500~2300 UTC. At 212 mb, both raqms_bc and sat_bc improve O3 simulation in the circled regions. 16 Aug. 2006 – CMAQ Modeled NOx + LNOx Fig 10. (a) OMI NO2 columns resampled to CMAQ grids (36km x 36km) and interpolated to minimize no-data. (b) CMAQ modeled NO+NO2 with lightning NOx. LNOx scenario variables: IC/CG=1 [Ott, et al., 2007], NOx=500 moles/stroke [Hudman et al., 2007 and references therein], IC altitude= upper troposphere only (a) PART I: Satellite trace gases • Anthropogenic emissions from lightning are dominant source of mid- and upper-tropospheric NOx and ozone [Hudman et al., 2007; Singh et al., 2007; Cooper et al., 2006; Li et al., 2005, Biazar and McNider, 1995]. • OMI NO2 column retrievals, Fig 1a, suggest some correspondence with lightning data (Fig 2). • Lightning NOx calculations, Fig 2, adjusted for IC/CG, molar fractions and altitude • Using OMI NO2 as CMAQ IC/BC and lightning NOx as anthropogenic emission source should help improve NOx and ozone forecasts (red and white arrows). AURA/OMI orbits over USA (8/21/2006) OMI O3 Averaging Kernel Fig 11. Lightning NOx calculated from daily total lightning recorded by U.S. National Lightning Detection Network sampled by CMAQ grids. Other satellite trace gases (NO2/HCHO/CO) (8/21/2006) (Will be used as model constraints in future study) (red pixel) OMI Trop. NO2 column OMI HCHO column AIRS CO at 700 mb OMI O3 gridded to CMAQ resolution; 1013-701mb; 8/21/2006 QUANTIFICATION OF LIGHTNING GENERATED NOX:SOUTHEASTERN U.S. TROPOSPHERIC NOX AND OZONE ENHANCEMENT DURING IONS06 • Significance of vertical lightning emission profile • Forward particle trajectories (PT) from lightning [Cooper, 2007], backward PT from ozonesonde measurements, intersection of PT is lightning signature probability distribution. • Adjust for STE [Cooper, 2006] and trajectory intersection with convective systems • Compare results with CMAQ chemistry, OMI retrievals, North American Lightning Climatology, and published laboratory experiments for stroke signal strength and LNOx emission • Case Studies: • Recurring Summertime Stagnant Southeastern Anticyclonic Circulation – pollution aging [Cooper (2006); Owen (2006)], horizontal and downward transport • North Alabama Lightning Mapper Array – vertical emission profile, CG/IC ratios, compare to current parameterizations. Fig. 6 OMI NO2, HCHO and AIRS CO on Aug. 21, 2006. Fig. 2 OMI O3 averaging Kernel at (32.21N, 97.68W), Aug. 21, 2006 Fig. 1 Aura/OMI Level 2 O3 profiles (24 layers) are mapped to CMAQ horizontal domain (36km x 36km) using a “drop-in-the-box” method. PART II: Assimilation of MODIS & CALIPSO Aerosol Products • MODIS L2 from Terra(10:30) and Aqua(13:30) are combined and mapped to CMAQ 36-km grid spacing. • Data coverage is increased by replacing missing pixels by the average of surrounding pixels. • MODIS fine fraction is used to partition fine & coarse mode aerosols. • CMAQ AOD is based on IMPROVE equation. • For fine mode, CMAQ aerosol profiles are scaled as Evaluation of Modeled O3 with IONS06 Ozonesondes Model result – PM2.5 Conclusions Using either OMI tropospheric ozone profiles directly (“satbc”) or as OMI total-column ozone observation assimilated into RAQMS (“raqms_bc”) as lateral boundary conditions for CMAQ, improves the middle and upper-tropospheric ozone calculations. Using MODIS aerosol information as boundary conditions also significantly changes the CMAQ aerosol calculations. The lightning-generated NOx effect on tropospheric ozone is a complicated process to diagnose. Fig. 7 Along the track mass concentration from MODIS and CMAQ. Fig. 8 Scaled CMAQ fine aerosol profiles. Elemental carbon mass ((a),(b)) and Anthropogenic organic mass ((c),(d)) ( [red line : scaled mass, blue line : original mass] Fig. 4 Evaluation of model results/satellite data with ozonesondes during Aug. 2006. Using OMI O3 directly (“satbc”) or through RAQMS (raqms) as lateral boundary conditions improves middle-upper tropospheric O3 simulation. Fig. 3 Huntsville ozonesondes compared with 3 CMAQ runs: (1) cntrl (2) raqms_bc (3) sat_bc Fig. 9 Modeled PM2.5. Top pannel: PM2.5 calculated from CMAQ control run. Bottom pannel: Difference of PM2.5 between SATBC run and CNTRL run. Geostationary Coastal and Air Pollution Events Science Definition Planning Workshop August 18-20, 2008 University of North Carolina, Chapel Hill, NC


