Application and Analysis of Data Mining Techniques in a Learning System
10 likes | 79 Views
Explore the implementation and results of various algorithms in a learning system, including discretizers, clusterers, feature subset selectors, and classifiers. Comprehensive evaluation using a 5x5 Cross Validation method.

Application and Analysis of Data Mining Techniques in a Learning System
E N D
Presentation Transcript
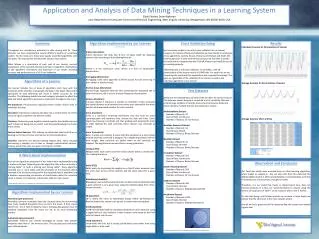
Application and Analysis of Data Mining Techniques in a Learning System Elijah Flesher, Drew Waltman Lane Department of Computer Science and Electrical Engineering, West Virginia University, Morgantown, WV 26506-6109, USA Summary Throughout our introductory education in data mining with Dr. TimmMenzies, we have implemented several different aspects of a learning system. For the most part, these were largely unverified algorithms until this point. This experiment will detail the results of our system. What follows is a description of each part of our learner, succinct explanation of the concepts behind each type of algorithm, descriptions of the algorithms themselves and disclosure of our results including accuracy and performance in a 5x5 Cross Validation. Algorithms Implemented by our Learner (Continued) N-bins (discretizer): N-bins discretizes the data into N bins of equal width by replacing numeric data according to the following formula: Where X is the continuous value. N-bins is a form of equal-width-discretization. Bin-logging (discretizer): Bin-logging is the same algorithm as N-bins except N is set at the log of the number of distinct values. . Normal-chops (discretizer): Normal-chops separates data into bins containing the sequential N% of data from the set; this is a form of equal-frequency-discretization. Kmeans (clusterer): K-means chooses k instances at random as centroids. It then computes the closest distance to all centroids and moves each centroid to the mean position of all asociated member for each centroid. Genic (clusterer): Genic is a stochastic clustering mechanism that was built for serial communication and therefore only reviews the data one time. Genic begins by choosing ncentroids and then grading each, keeping the most fit. After deleting the unfit centroids, Genic chooses new centroids at randm. Genic 2 (clusterer): Genic 2 works very similarly to Genic with the exception of a self-pruning method whereby a centroid is dropped if it’s weight drops below half the max. weight. New centroids are added when no old centroids are dropped. The algorithm terminates after so many generations. InfoGain(FSS): Infogain ranks each column and then reject column below a certain rank. The ranking formula is: Relief (FSS): Relief works by improving the weights on a field if other elements have the same class as the current element and the same values for a given field. NaïveBayes (classifier): NaïveBayes uses a mathematical formula to determine the likelihood that a given element is of a given class using the statistical data from other, known elements. 2B (classifier): 2B is nearly the same as NaïveBayes except before performing the Baysian analysis the columns are paired to create new training data. OneR (classifier): OneR uses multiple fields to calculate probability of errors based on using a single field as a class indicator. It then creates a rule based on the field with the lowest rate of error. TwoR (classifier): TwoR works like OnR, but it creates paired data to test rather than using single fields as with oneR. Cross Validation Setup We have setup scripts to run a 5x5 cross validation for our learner. However, for reasons of time and reliability, we have decide to omit some of our algorithms, namely, Genic2, kMeans and InfoGain and OneR. We have found issues in time with Genic2 but have not had time to profile the code and our implementations of OneR, kMeans and InfoGain are not yet working properly. That being said, a 5x5 cross validation, on six tables , with 18 permutations of the learner results in 1080 trials. For each trial, we are comparing the result with the expectation and compute the average. This gives us a good idea of the reliability of our learner as well as the individual algorithms in our learner. Results Individual Accuracy for Permutations of Learner Average Accuracy for Permutations of Learner Average Accuracy Chart and Key Algorithms of a Learner Our learner includes five se types of algorithms. Each type, with the exception of the classifier, manipulates the data in the hopes that certain operations of data reforming will result in better accuracy for the classifier. The following details how each category attempts to effect the data and which algorithms we chose to implement throughout the cours Pre-processors: Pre-processors typically remove outliers and/or scale or normalize the data. Discretizer:Discretizers compress the data into a small number of of bins so that a signal or pattern may become visible. Clusterer: Clusterers group together related rows for the classifier to train with in hopes of being able to predict rows that would belong to a cluster more clearly. Feature Subset Selector: FSS’s attempt to isolate data that has little or no bearing on the record’s class and remove it from consideration. Classifier: Classifiers are decision-making engines that, either through discovering a complex set of rules or through mathematical decision-making, predict the class of a given record given its fields. • Test Datasets • Below are the characteristics of each of the six tables we ran the trials on. This data was chosen because it contained a lot of variability. We have small to large numbers of records, discreet and continuous fields and binary discreet, multiple discreet and continuous classes. • AdditionalBolts Dataset • Number of Records: 10 • Type of Data: Continuous • Number of Classes: Inf. Continuous • Weather-Numerics Dataset • Number of Records: 14 • Type of Data: Mixed • Number of Classes: Binary Discreet • Weather Dataset • Number of Records: 14 • Type of Data: Discreet • Number of Classes: Binary Discreet • Ionosphere Dataset • Number of Records: 351 • Type of Data: Continuous • Number of Classes: Binary Discreet • Boston-Housing Dataset • Number of Records: 506 • Type of Data: Continuous • Number of Classes: Inf. Continuous • Soybean Dataset • Number of Records: 683 • Type of Data: Discreet • Number of Classes: Multiple Discreet (19) • Mushroom Dataset • Number of Records: 8124 • Type of Data: Discreet • Number of Classes: Multiple Discreet (7) • * All data sets provided by Dr. TimmMenzies as part of the course instruction set. A Word about Implementation Each of the algorithms presented in this report were implemented using a similar prototype. Depending on the algorithm, they either took only a training table* or both a training and testing table*. Every algorithm returned one or more tables with the exception of the classifiers which returned a list of classes compared to the expected class (if available) and a boolean representing correctness of classification when the expected result is known. The clusterers retuned one table for each cluster. * Table refers to a table structure provided by Dr. TimmMenzies as part of the course instruction set. Observation and Conclusion Our TwoR was wildly more accurate than our other learning algorithms, which makes us suspicious. We can also note from this data that the AdditionalBolt dataset is either unpredictable or contained data such that is hindered one of our learners, though not TwoR. Therefore, it is our belief that TwoR, as implemented here, does not function properly. It is thus our recommendation to anyone using this learner, be suspicious of TwoR – we do however plan to test it further. For the time being, until further analysis can be done in more depth, we believe that the 2b learner is the more reliable system. Overall we had a great deal of fun implementing this system and learned a great deal. Algorithms Implemented by our Learner Normalize (pre-processor): Normalize converts numerical data into discreet values by determining how many standard deviations they are form the mean. If then scores them from -3 to 3 with 0 being the mean. Outlying data greater than ±3 standard deviations from the mean are set to ±3, thus eliminating outliers. Subsample (pre-processor): Subsample removes any records belonging to classes with greater frequency than that of the minority class. This pre processor eliminates over-inflated classes.