
Uploaded by
janina
1 SLIDES
149 VIEWS
10LIKES
DESCRIPTION
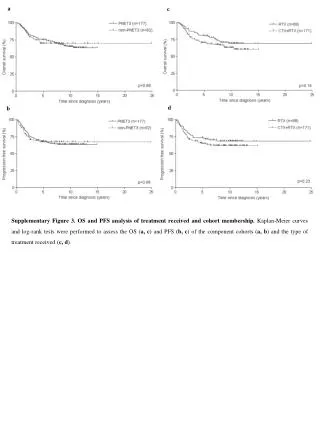
a. c. d. b. Supplementary Figure 3 . OS and PFS analysis of treatment received and cohort membership. Kaplan-Meier curves and log-rank tests were performed to assess the OS ( a, c ) and PFS ( b, c ) of the component cohorts ( a, b ) and the type of treatment received ( c, d ).
Download
1 / 1
Download Presentation 
An Image/Link below is provided (as is) to download presentation
Download Policy: Content on the Website is provided to you AS IS for your information and personal use and may not be sold / licensed / shared on other websites without getting consent from its author.
Content is provided to you AS IS for your information and personal use only.
Download presentation by click this link.
While downloading, if for some reason you are not able to download a presentation, the publisher may have deleted the file from their server.
During download, if you can't get a presentation, the file might be deleted by the publisher.
E N D
Presentation Transcript
a c d b Supplementary Figure 3. OS and PFS analysis of treatment received and cohort membership. Kaplan-Meier curves and log-rank tests were performed to assess the OS (a, c) and PFS (b, c) of the component cohorts (a, b) and the type of treatment received (c, d).
More Related