Download
1 / 19
190 likes | 211 Views
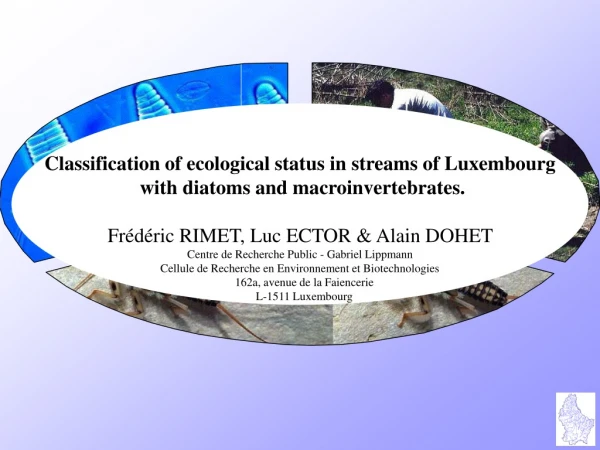
This study conducted by Frédéric Rimet, Luc Ector, and Alain Dohet from the Centre de Recherche Public - Gabriel Lippmann in Luxembourg, focused on assessing the ecological status of small streams in Luxembourg using diatoms and macroinvertebrates. Through samplings at 145 sites in autumn and spring, the researchers collected 289 samples and analyzed the data using tools like TWINSPAN ordination and canonical correspondence analysis. The study highlighted the impact of physico-chemical parameters and identified key indicator species for different environmental conditions, emphasizing the importance of monitoring biodiversity for stream health.

E N D
Classification of ecological status in streams of Luxembourg with diatoms and macroinvertebrates. Frédéric RIMET, Luc ECTOR & Alain DOHET Centre de Recherche Public - Gabriel Lippmann Cellule de Recherche en Environnement et Biotechnologies 162a, avenue de la Faiencerie L-1511 Luxembourg
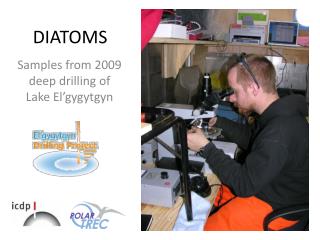
Belgium Germany N Luxembourg France Diatoms Physico-chemical parameters 10 km Macroinvertebrates Samplings in 145 sites of the small streams in automn and spring (289 samples)
N All diatom data Group A ( ) Group B ( ) 10 km 10 km Group A1 ( ) Group A2 ( ) Group B1 ( ) Group B2 ( ) Diatoms TWINSPAN ordination realized on diatom data.
Schist of WiltzQuartzite of BerléSlate schist Schist Devonian Rumelange Limestone Oil Shale Medioliasic sandstone Marl and limestone of Strassen Sandstone of Luxembourg Jurassic Gypsum Gypsum (Conchiferous sandstone) Sandstone of Born Trias Geology Low conductivity Low pH Low hardness High conductivity High pH High hardness
ACON SSEM A1 NAMP NCPL B1 NVEN NSSY ALAU NPAE NMIN NSBM FSBH FULN NCRY NPAL FCVE NACI NJOU CMEN NVGE CPED FMOC NSAP NIPU NTUB NATO CRAC MCCO NZSU NGRE axis 2 DVUL FCVA ALFR NMEG group A1 GPAR NLAN CSLE NREC NAPE RABB SANG SHAN NRCH NSOC CPST APED NTPT LMUT NACD group A2 SHTE GNOD CMIN CBAC NRHY NCTE SBRE DMON MVAR NINC NPAD TPSN NDIS EMIN NMLF NCOT FCAP group B1 FVUL FVIR NFON FCRU NMIS NSLU NDME MCIR CPLI GMIN NIAR DCON NLIN NTEN group B2 CREI RSIN FPIN GOLI CPLE AMIN NIAC STHE GMIC GPUM NSUC ALAN DMES ABIA NALP ADAO B2 GPXS ABSU PSEL CPPL GOOL A2 Species axis 1 +1.0 K+ NH4+ total phosphorus stream order DBO5 conductivity Cl- PO42- distance to source Na+ total hardness NO2- SO42- NO3- carbonate hardness Temperature Altitude pH O2 slope -1.0 +1.0 -1.0 Sampling stations canonical correspondence analysis of diatom data Physico-chemical parameters
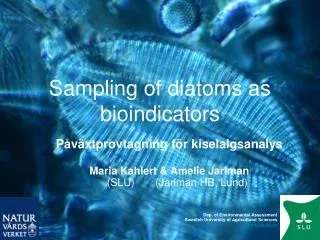
Achnanthes minutissima 10 km Achnanthes biasoletiana var. subatomus Gomphonemaolivaceum var. olivaceoides Amphora pediculus Cocconeis placentula var. lineata Gomphonema pumilum 10 mm Indicative species of reference sites (Indicator Species Analysis, Dufrene & Legendre 1997) Group A2 Group B2
Diptera Odonata Hirudinea Crustacea Plecoptera Actinedida Turbellaria Coleoptera Trichoptera Heteroptera Gastropoda Oligochaeta Megaloptera Ephemeroptera Macro-invertebrate diversity 149 sampling stations (spring & autumn) - Rhithral Max 40 Min 120 75% • About 700 taxa identified at species level • More than 60 different taxa per site on average • Diptera and Trichoptera are by far the most diverse groups 25% 100 30 Median 80 20 60 40 10 20 0 0 Taxa richness
Carbonate hardness Slope NH 4 Diptera Trichoptera Ephemeroptera Coleoptera Plecoptera Oligochaeta Crustacea Actinedida Gastropoda Hirudinea Turbellaria Odonata Megaloptera Heteroptera DBO 5 Organic pollution x + Stream order x + -2.0 CCA Axis 1 +5.0 Ordination diagram based on partial canonical correspondence analysis of macro-invertebrate data +2.5 • Organic pollution and carbonate hardness are the most important gradients explaining differences in macrofauna composition between streams • Slope and stream order are secondary gradients • Most Diptera taxa are tolerant and inversely most Trichoptera taxa are sensitive to organic pollution. Together, these 2 orders cover a large range of environmental conditions CCA Axis 2 -2.5
Identification of typology and bioindicator species among Ephemeroptera, Plecoptera and Trichoptera with the INDicator VALue method (Dufrêne & Legendre 1997) Index of Organic pollution IPO Distance from Source (m) Carbonate hardness THCa °F • Based on EPT data, 4 groups of sites were identified • Environmental variables were used a posteriori to characterise these 4 groups of sites • Again, organic pollution, carbonate hardness and stream order were the best environmental variables to differenciate between site groups • Most EPT taxa are significative indicators of best water quality sites (groups 1 and 3). EPT Indicators are less numerous in highly mineralised streams (group 2) and in sites characterised by moderate organic pollution (group 4), confirming that most taxa belonging to these orders are pollution sensitive
Expected flora and fauna Observed flora and fauna Automatised comparisons Environnemental data Prediction of the flora and the fauna if the site is not distrubed Environmental and biological Database of reference sites Biological samplings Biological quality assessment
PAEQANN PAEQANN Predicting Aquatic Ecosystem Quality using Artificial Neural Networks: Impact of Environmental characteristics on the Structure of Aquatic Communities (Algae, Benthic and Fish Fauna) Coordination : Prof. Sovan LEK Univ. Paul Sabatier Toulouse (France)
PAEQANN Ecosystem ? Community Structure Improvements Health of the Ecosystem Tools for Assistance to the Public Prosecutor decisions Assistance to Political decisions - Quality objectives Current diagnosis Assistance to - Legislation Ecosystem simulations Environment Managers - Management - Restoration Administration Sphere Institutions of : - European Community - Countries PAEQANN - Regions Objectives of PAEQANN
ANN Backpropagation algorithms Self Organizing Mapping (SOM) PAEQANN Which models are used in PAEQANN ? Bayesian models Goal function modelling Which bio-indicators are studied in PAEQANN ? Diatoms Macroinvertebrates Fish
S. Lek 1. France, Univ. Paul Sabatier, CESAC lab 2. Denmark, Univ. Copehargen, DFH, Env. Chemistry lab S.E. Jorgensen M. Scardi 3. Italy, Univ. Bari, Dep. Zoology 4. Belgium, Univ. Namur, Freshwater Ecology lab (LFE) FUNDP J.P. Descy F. Delmas / M. Coste 5. France, CEMAGREF, Bordeaux 6. Luxemburg, Cell. Recherche Environ. Biotechnol. L. Ector P.F.M. Verdonschot 7. The Netherland, Institute Forest & Natural Research, Freshwater Ecol. team H.M. Knoflacher 8. Austria, Austrian Research Center Seibersdorf PAEQANN Who are the partners ?
DIAMON DIAtoms as MONitors of the Ecological Status of European Rivers A standardised ecoregion based approach to support the EU Water Framework Directive Co-ordinator University of Innsbruck, Austria (UNIIB) Eugen Rott, Eveline Pipp, Ingrid Hayek, Peter Pfister
Main objectives Developpement of practical tool for assessing river quality in the European rivers. Harmonisation of : Taxonomy, methods, evaluation systems Define reference diatoms communities in the different ecoregions (WFD)
Who are the partners ? 1. Austria, Univ. Innsbruck E. Rott, E. Pipp, I. Hayek, P. Pfister 2. France, Water Agency Artois-Picardie J. Prygiel, C. Lesniak 3. United Kingdom, Bowburn Consultancy M. Kelly 4. France, CEMAGREF M. Coste, F. Delmas 5. Germany, EcoRing E. Coring, J. Bäthe, J. Kuhl, G. Pogrzeba 6. Spain, Univ. Barcelona S. Sabater, I. Munoz, Portugal, Univ. Aveiro S. Almeida 7. Switzerland, Univ. Zürich H.R. Preisig, J. Hürlimann, F. Straub 8. Netherlands, Univ. Amsterdam W. Admiraal, N. Ivorra Aquasense 9. Norway , Norwegian Institute for Water Research E.A. Lindstroem, T. Andersen Sweden, ALcontrol A. Jarlman 10. Hungary, Hungarian Danube Research Station, E. Acs, K. Kiss 11. Italy, Museum of Natural Sciences of Trento, M. Cantonati 12. Luxembourg, Centre de Recherche Institut Gabriel Lippmann, L. Ector, L. Hoffmann 13. United Kingdom, Univ.Newcastle, S. Juggins, R. Telford, A. Clarke