Spectral Clustering for Complex Data: A Comprehensive Guide
400 likes | 429 Views
Explore the power of spectral clustering for complex cluster shapes, with insights on eigenvectors, eigenvalues, and algorithm selection. Learn to optimize clustering results and choose the right parameters for your dataset.

Spectral Clustering for Complex Data: A Comprehensive Guide
E N D
Presentation Transcript
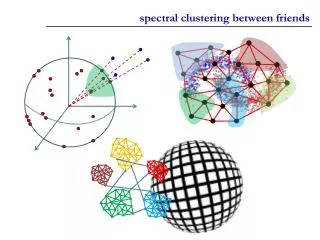
Spectral Clustering Most slides are from Eyal David’s presentation
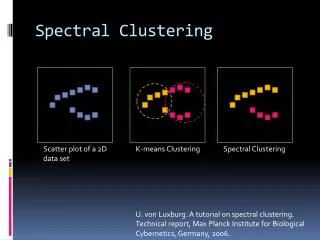
Dataset exhibits complex cluster shapes • K-means performs very poorly in this space due bias toward dense spherical clusters. In the embedded space given by two leading eigenvectors, clusters are trivial to separate. Spectral Clustering Example – 2 Spirals
Why? • If we eventually use K-means, why not just apply K-means to the original data? • This method allows us to cluster non-convex regions
User’s Prerogative • Affinity matrix construction • Choice of scaling factor • Realistically, search over and pick value that gives the tightest clusters • Choice of k, the number of clusters • Choice of clustering method
Largest eigenvalues of Cisi/Medline data λ1 • Choose k=2 λ2 How to select k? • Eigengap: the difference between two consecutive eigenvalues. • Most stable clustering is generally given by the value k that maximises the expression
Summary • Spectral clustering can help us in hard clustering problems • The technique is simple to understand • The solution comes from solving a simple algebra problem which is not hard to implement • Great care should be taken in choosing the “starting conditions”