Download
1 / 56
560 likes | 669 Views
Detecting the Moment of Learning. Ryan S.J.d . Baker Adam B. Goldstein Neil T. Heffernan. Talk Outline. Introduction Data P(J) model Labeling Process Features ML Procedure Results Spikiness Models Conclusions. In recent years….

E N D
Detecting the Moment of Learning Ryan S.J.d. Baker Adam B. Goldstein Neil T. Heffernan
Talk Outline • Introduction • Data • P(J) model • Labeling Process • Features • ML Procedure • Results • Spikiness Models • Conclusions
In recent years… There has been work towards developing better and better models that can predict if a student has learned a skill up to a certain time [Corbett & Anderson, 1995; Martin & VanLehn, 1995; Shute, 1995; Conati et al, 2002; Beck et al, 2007, 2008; Pardos et al, 2008; Baker et al, 2008, 2010; Pavlik et al, 2009]
E.g. W R W W R W W R R W R RR The student has a 84% chance of now knowing the skill
In this paper… • We go a step further, and try to assess not just • Whether a student knows the skill • But also • When the student learned it
E.g. The student probably learned the skill at W R W WRWWRRW RRR
Why is this useful? Better understand the conditions and antecedents of learning May be possible to change style of practice after these inflection points, from focusing on learning skill to focusing on gaining fluency
Why is this useful? • Better understand the conditions and antecedents of learning • May be possible to change style of practice after these inflection points, from focusing on learning skill to focusing on gaining fluency • Even if we’re just catching an inflection point in the strength of association rather than an actual “eureka” moment, this still might be relevant and useful
How do we do it? Very much like the models that detected contextual probability of guessing and slipping (Baker, Corbett, & Aleven, 2008)
How do we do it? We take an action, and the probability the student knows the skill at that point, according to Bayesian Knowledge Tracing (Corbett & Anderson, 1995) We look at the next two actions We apply Bayes’ Theorem This gives us training labels; we then develop a model that uses only features from the current action and the past
High-Level • 5% probability student knew skill • W WW • Skill was probably not learned at red action
High-Level • 90% probability student knew skill • R RR • Skill was probably not learned at red action
High-Level • 30% probability student knew skill • R R R • Skill was quite possibly learned at red action (or previous action)
High-Level • 30% probability student knew skill • W R R • Skill was quite possibly learned at red action (or next action)
High-Level • 30% probability student knew skill • W W R • Skill was probably not learned at red action
Now, for more details… My co-author, Adam Goldstein
Talk Outline • Introduction • Data • P(J) model • Labeling Process • Features • ML Procedure • Results • Spikiness Models • Conclusions
Data used 232 students’ use of CMU’s Middle School Cognitive Tutor Math classes in one middle school in Pittsburgh suburbs during 2002-2003 Used tutor twice a week as part of their regular curriculum 581,785 transactions 171,987 problem steps over 253 skills
Talk Outline • Introduction • Data • P(J) model • Labeling Process • Features • ML Procedure • Results • Spikiness Models • Conclusions
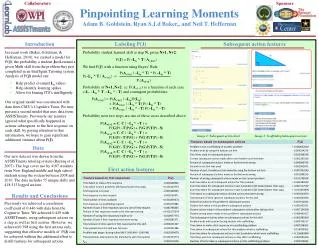
Labeling P(J) Bear with me, it’s worth it Primarily considered with this statement: P(J) = P(~Ln ^ T | A+1+2 ) *Note how it is distinct from T P(T) = P(T | ~Ln) P(J) = P(~Ln ^ T)
P(J) is distinct from P(T) Bear with me, it’s worth it Primarily considered with this statement: P(J) = P(~Ln ^ T | A+1+2 ) *Note how it is distinct from T P(T) = P(T | ~Ln) P(J) = P(~Ln ^ T)
Labeling P(J) P(A+1+2 | ~Ln ^ T) * P(~Ln ^ T) P (A+1+2 ) We can better understand P(~Ln ^ T | A+1+2 ) with an application of Bayes’ rule P(~Ln ^ T | A+1+2 ) =
Labeling P(J) Base probability P(~Ln ^ T ) computed using a student’s current P(~Ln) and P(T) from BKT P(A+1+2 )is a function of the only three relevant scenarios, {Ln, ~Ln ^ T, ~Ln ^ ~T}, and their contingent probabilities P(A+1+2 ) = P(A+1+2 | Ln)P(Ln) + P(A+1+2 | ~Ln ^ T) P(~Ln ^ T) + P(A+1+2 | ~Ln ^ ~T) P(~Ln ^ ~T)
Labeling P(J) And finally: Probability of actions at N+1 and N+2 is a function of BKT’s probabilities for guessing (G), slipping (S), and learning the skill (T) (Correct answers are notated with a C and incorrect answers are notated with a ~C) (A full list of equations is available in the paper) P(A+1+2 = C, C | Ln) = P(~S)P(~S) P(A+1+2 = C, ~C | Ln) = P(S)P(~S) P(A+1+2 = ~C, C | Ln) = P(S)P(~S) P(A+1+2 = ~C, ~C | Ln) = P(S)P(S)
Labeling P(J) • Future data is used only in training. P(A+1+2 = C, C | Ln) = P(~S)2 P(A+1+2 = C, ~C | Ln) = P(S)P(~S) P(A+1+2 = ~C, C | Ln) = P(S)P(~S) P(A+1+2 = ~C, ~C | Ln) = P(S)2
Labeling P(J) </torture> But don’t forget: P(J) = P(~Ln ^ T | A+1+2 )
Talk Outline • Introduction • Data • P(J) model • Labeling Process • Features • ML Procedure • Results • Spikiness Models • Conclusions
Features of P(J) Used log information on data from already completed student usage of the tutor Defined behavior that may be indicative of knowledge acquisition Developed a means to quantify or observe that behavior Used same set of features as seen in [Baker, Corbett, and Aleven 2008]
Features of P(J) • In training • The label P(J) uses future data from logs • We machine learn weights for each feature to predict P(J), using only past/present data • In test • To predict P(J) we calculate these features and apply the learned weights using only information available at run time
Example Features All features use only first actions
What some of those numbers mean • P(J) is higher following incorrect responses • [Citation] • P(J) decreases as the total number of times student got this skill wrong increases • Might need intervention not available in the tutor
What some of those numbers mean • P(J) is lower following help requests • Stands out in contrast to [Beck et al 2008] • P(J) is higher when help has been used recently, i.e. in the last 5 and/or 8 steps
Talk Outline • Introduction • Data • P(J) model • Labeling Process • Features • ML Procedure • Results • Spikiness Models • Conclusions
Features of P(J) • In RapidMiner, ran linear regression to make a model for correlation between our features and the P(J) label • Two feature sets run through 6-fold student-level cross validation • 25 including Ln and Ln-1: .446 correlation to labels • 23 not including Ln and Ln-1: .301 correleation
Features of P(J) • Argument could be made that using BKT probabilities (Ln) in the definition of the label (~Ln ^ T) is wrong • We consider this to be valid - Interesting part is the T, not the Ln • Even if you don’t buy it, a .301 correlation coefficient is certainly still something
Back to Ryan For some discussion of analysis of P(J)
Talk Outline • Introduction • Data • P(J) model • Labeling Process • Features • ML Procedure • Results • Spikiness Models • Conclusions
Research question Does learning in intelligent tutors have more of a character of gradual learning (such as strengthening of a memory association [cf. Pavlik & Anderson, 2008]) or learning given to “eureka” moments, where a skill is understood suddenly? [Lindstrom & Gulz, 2008] Does this vary by skill?
To answer this We can plot P(J) over time, and see how “spiky” the graph is Note that this is effectively the derivative of the more standard theoretical learning curve (cf. Corbett & Anderson, 1995; Koedinger et al, 2008)
Real Data for One Student(Two different skills) P(J) OPTOPRAC
Real Data for One Student(Two different skills) P(J) OPTOPRAC
As you can see… One skill was learned gradually, the other skill was learned suddenly Note that the first graph had *two* spikes This was actually very common in the data, even more common than single spikes
As you can see… • One skill was learned gradually, the other skill was learned suddenly • Note that the first graph had *two* spikes • This was actually very common in the data, even more common than single spikes • I would very much appreciate hypotheses for why this happens, as I don’t have a good theoretical explanation for this
We can quantify the difference between these graphs • We can quantify the degree to which a learning sequence involves a “eureka” moment, through a metric we call “spikiness” • For a given student/skill pair, spikiness = • Max P(J)/Avg P(J) • Scaled from 1 to infinity
Looking at spikiness • We only consider action sequences at least 6 problem steps long • (Shorter sequences tend to more often look spiky, which is a mathematical feature of using a within-sequence average) • We only consider the first 20 problem steps • After that, the student is probably floundering
Spikiness by skill Min: 1.12 Max: 113.52 Avg: 8.55 SD: 14.62 Future work: What characterizes spiky skills and gradually-learned skills?
Spikiness by student Min: 2.22 Max: 21.81 Avg: 6.81 SD: 3.09 Students are less spiky than skills
Interestingly • The correlation between a student’s spikiness, and their final average P(Ln) across skills is a high 0.71, statistically significantly different than chance • Suggests that learning spikes may be an early predictor of whether a student is going to achieve good learning of specific material • May someday be the basis of better knowledge tracing
One of… One of many analyses potentially enabled by this model
Worth Noting • Generally across all actions on a skill, P(J) levels don’t quite add up to a total of 1 across all actions • In general, our model is representative of P(J) at lower levels but tends to underestimate the height of spikes • May be a result of using linear modeling approach for a fundamentally non-linear phenomenon • May also be that P(J) is actually too high in the training labels (where it often ends up significantly above a total of 1) • Could be normalized, for the purposes of spikiness analyses, we believe the model biases towards seeing less total spikiness