Download
1 / 37
370 likes | 388 Views
This study examines the concurrent validity of five alternative outcome metrics for the Child and Adolescent Needs and Strengths (CANS) assessment tool. The metrics were evaluated for their association with concurrent measures of program success across different service levels.

E N D
Concurrent Validity of Alternative CANS Outcome Metrics William A. Shennum Julian Leiro Delisa Young Five Acres Altadena, California
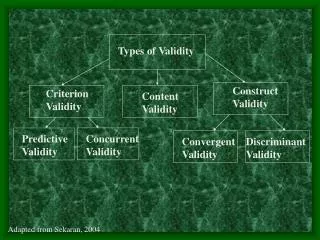
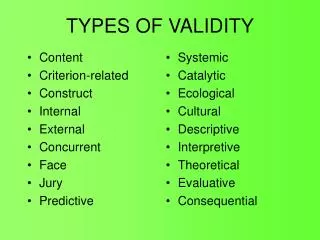
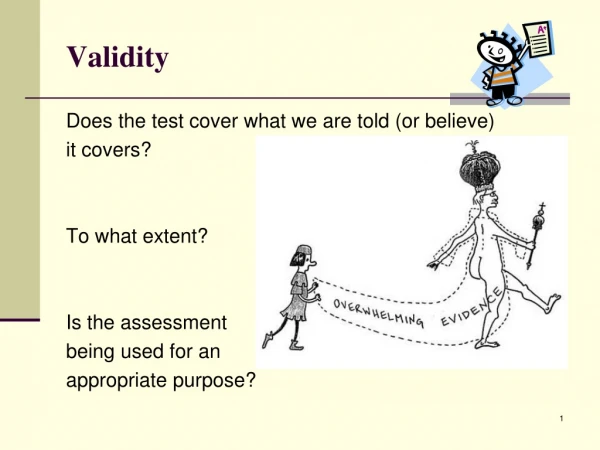
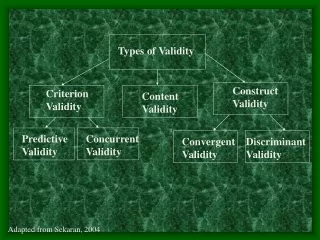
What is test validity? • The concept of validity was formulated by T.L. Kelley in 1927, who stated that a test is valid if it measures what it claims to measure. • For example a test of intelligence should measure intelligence and not something else, such as memory. Simplypsychology.org/validity
Concurrent validity • Concurrent validity is a measure of how well a particular test correlates with a previously validated measure of the same construct. • Concurrent validity relies upon measurements that take place at the same time. Explorable.com
Who we are • Non profit organization serving greater Los Angeles community • Research & Evaluation Department • Outcome & performance measurement • Quality & business process improvement • Program evaluation • Project management
Why CANS? • Need for a common outcome measure across programs for use in planning & CQI. CANS roll-out • Training • Inspiration – Dr. Lyons’ visit • Technology • Reporting
What About Program –Level CANS Outcomes? • Several scoring options available • Which ones work best? • Easily understood by stakeholders • Closely associated with other outcomes important to the organization (concurrent validity)
Study Design Three service levels were included. 1. Community based mental health 2. Wraparound 3. Residential treatment
Study Design - continued • Youth intake and discharge CANS were compared (N=233) • Five CANS outcome scoring metrics were computed for each youth • Statistical associations of each CANS metric with concurrently measured discharge outcomes were examined.
Metric 1. Intake-discharge change scores Method: Compute the average change from intake to discharge, for total score and for each domain • Strength- easy to calculate • Weaknesses – unit of measurement not common-sense, not tied to clients’ specific needs
Metric 2 - Reliable Change Index Analysis Method: Determine whether each individual’s change score is statistically significant, by comparing it with a Reliable Change cutoff value • RCI Formula: change in an individual’s score divided by the standard error of the difference for the test. • Parameters in formula include Intake and Discharge scores, test standard deviations, and test (rater) reliability. • Result is a yes-no score for each youth, for CANS total score, and each domain. • Strength: statistically sound • Weaknesses: difficult to compute and explain to stakeholders
1. Calculate standard error of measurement 2. Calculate standard error of the difference How to Calculate the RCI 3. Calculate RCI If RCI is 1.96 or greater, the difference is statistically significant (95% confidence level, 2-tailed). 1.65 = one-tailed test cutoff M. Horsill, www.psy.uq.edu.au
Metric 3. Reduction in Number of Actionable Needs Method: Compare the number of actionable needs at intake and discharge, total and by domain. • Strength- addresses standout needs • Weakness- not tied to an individual’s specific needs identified at intake.
Metric 4 - % Actionable Needs Resolved Method: Track specific actionable items identified at intake, and calculate the % of these that are no longer actionable at discharge, total and by domain. • Strengths - tailored to individual, easy for stakeholders to understand • Weakness – somewhat complicated scoring
Metric 5 – Actionable Needs Improved Method: Track specific actionable items identified at intake, and calculate % of these that show any improvement, even if still actionable at discharge, total and by domain. • Strength - tailored to individual, easy for stakeholders to understand • Weaknesses – includes needs still remaining at discharge, somewhat complicated scoring
Concurrent Validity of the 5 CANS Program Outcome Metrics • Are the metrics statistically associated with concurrently collected measures of program success?
All CANS Metrics Significantly Associated with Concurrent Program Outcomes
Specific CANS Domains were Positively Associated with Concurrent Outcomes
Trends “Reduction in number of actionable needs” and “% of actionable needs resolved” metrics tended to work best for most programs “Average change score” metrics worked well in program serving less severe youth Suggestive evidence favored youth strengths domain as a driver of overall improvement CANS outcome profiles for successful youth were similar across programs – benchmarks would assist in setting performance targets.
Take Aways • All CANS metrics examined showed evidence of concurrent validity across a range of programs • All CANS domain improvements were related to concurrent outcomes, with suggestive evidence that “youth strengths” had strongest relationship to success. • Programs serving higher severity needs may benefit from measuring metrics related to actionable need resolution and improvement. • Benchmark databases could assist programs in setting outcome targets for youth.
Contact Information Bill Shennum Director of Research & Evaluation Five Acres (626)798-6793 bshennum@5acres.org www.5acres.org