Download
1 / 27
270 likes | 445 Views
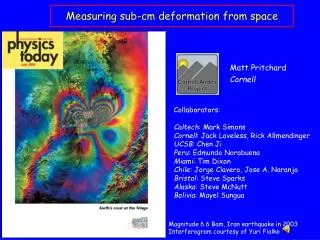
Measuring sub-cm deformation from space. Matt Pritchard Cornell. Collaborators: Caltech : Mark Simons Cornell : Jack Loveless, Rick Allmendinger UCSB : Chen Ji Peru : Edmundo Norabuena Miami : Tim Dixon Chile : Jorge Clavero, Jose A. Naranjo Bristol : Steve Sparks

E N D
Measuring sub-cm deformation from space Matt Pritchard Cornell Collaborators: Caltech: Mark Simons Cornell: Jack Loveless, Rick Allmendinger UCSB: Chen Ji Peru: Edmundo Norabuena Miami: Tim Dixon Chile: Jorge Clavero, Jose A. Naranjo Bristol: Steve Sparks Alaska: Steve McNutt Bolivia: Mayel Sungua Magnitude 6.6 Bam, Iran earthquake in 2003 Interferogram courtesy of Yuri Fialko
Measuring sub-cm deformation from space: Outline: Act 1: What am I looking at? Introduction to InSAR: what it is, where it works, and where it doesn’t work Act 2: Who cares? Magma migration at supposedly dormant volcanoes Act 3: No, really: who cares? “Silent” earthquakes triggering real earthquakes Interferogram courtesy of Yuri Fialko
Where in the world am I? • •Magnitude 6.6 earthquake: 26 December 2003 in Bam, Iran • • Arid and mountainous region with frequent earthquakes • (collision between Arabian and Eurasian plates) From: Farsinet.com • •Previously unmapped fault (right-lateral strike-slip) • North Bam Baravat 20 km 10 km Landsat satellite image from 1999, from Funning et al., 2005 Interferogram courtesy of Yuri Fialko
Where in the world am I? • •City of ~80,000 people -- about 80% of the city destroyed • ~30,000 casualties, mostly from collapse of mud roofs • North Bam 2,000(?) year old citadel destroyed by earthquake Baravat 20 km From: FEMA
What am I looking at? • • Each fringe: contour of ground deformation in direction of satellite radar beam • North • Each scene: • 20 meters per pixel • 100’s of km per image • Resolve deformation ~mm/year • This example: • From European space Agency Envisat satellite (5.6 cm radar wavelength) • Each fringe is 2.8 cm of deformation 20 km
Intro to InSAR: How does it work? Wright, 2002 • Two Radar images from space: • Data is complex: has amplitude and phase • Phase change between images depends on several factors that must be removed before measuring deformation Courtesy Rowena Lohman
Visualizing 3D deformation in a 1D interferogram • •Step 1: Fault motion produces 3D deformation field Both images: Funning et al., 2005 • •Step 2: Project 3D deformation onto satellite radar line-of-sight • •Step 3: Create a fringe every /4 centimeters (“wrapped image”)
Reconstructiong the full 3D deformation field • Use interferograms from different satellite look directions • PLUS: use the amplitude images to track pixels that moved Observed interferograms Observed pixel tracking Inferred horizontal displacement Inferred vertical displacement Fault Before After Fialko et al., 2005
Who cares? What have we learned about earthquakes? 1)Shallow slip deficit •To be released in future earthquakes? •To be released aseismically? •Result of bulk Inelastic failure? (e.g., numerous small faults instead of 1 big one?) Funning et al., 2005 Fialko et al., 2005 2)Earthquakes mislocated up to 30-50 km by global seismic networks Other Catalogs Harvard Catalog Mw 5.3 earthquake in southern Iran From: Lohman and Simons, 2005 10 km 3)Power-law viscoelastic and poroelastic response to sudden slip 4)Slow (aseismic slip) triggering earthquakes (e.g., Act 3 of this talk)
Don’t care about earthquakes? Some of InSAR’s other greatest hits Antartica ice stream velocities from InSAR/feature trackingAlso: glacier speed-up in Greenland: Implications for sea-level rise The Ups and downs of Las Vegas (From Groundwater Pumping) From: Bamber et al., 2000 Lost Hills, CA Oil FieldsubsidenceFielding et al., 1998 From: Amelung et al., 2000
InSAR: practical considerations 1) Data availability: None of these opimized for InSAR! Past: European (ERS-1/2; 5.6 cm ); Japanese (JERS; 24 cm) Present: European (Envisat; 5.6 cm ); Canadian (RADARSAT-1; 5.6 cm); Japanese (ALOS; 24 cm) Future: Canadian (RADARSAT-2; 5.6 cm); Repeating passes every 20-30 days; more frequent for special orbits Data not acquired during every overflight; can be expensive $100-1000’s per scene 2) Orbit control: Need repeat passes within few 100’s m 3) Atmospheric effects: Not always water vapor measurements to remove this effect -- can use multiple acquisitions to reduce this effect 4) Wavelength: Prefer longer wavelength to penetrate vegetation Mountain range Lee waves east of the Andean Western Cordillera 5 km
Comparing radar wavelengths at Hawaii Correlation maps Interferograms All images from Space Shuttle (SIR-C) span Apr-Oct From: Rosen et al., 1996
C-band coherence • High coherence • in dry areas • (near coast) • North-south • variations also • related to regional • climate
Uncovering the hidden lives of volcanic arcs • A few volcanoes are obviously active 1999 Eruption of Kliuchevskoi volcano, Kamchatka Photo by: A. Logan • … But some appear dormant and aren’t South Sister, Oregon From: Wicks et al., 2001 From: Hill et al., 2002 • Surface deformation exposes subsurface magma movements
Why expose volcanoes’ hidden lives? • Hazard: Understanding eruptive threat Can surface deformation be used to predict eruptions? - Only rarely – need to establish case history at each volcano Gain a more complete picture of volcano life cycle What really happens during long repose times? 2) What are the rates of magmatism in different areas? Separate rate of intrusion and extrusion: Example: Hawaii and Iceland. Same output, but maybe different inputs Why do rates of magmatism vary within arcs and between arcs? Airplane routes, From: USGS
Volcano personalities • Different volcanoes have different behaviors • Deformation and no eruption: e.g. Long Valley caldera • Eruption and no deformation: e.g. Lascar, Chile (this study) • Deformation and eruption: • Pattern: pre-eruptive inflation, co-eruptive deflation, post-eruptive inflation Dvorak and Dzurisin, 1997 From: J. D. Griggs
Lazufre: An intrusion without a volcano? • Clear lava flows at Lastarria … • … But nothing in • between “Lazufre” • Clear lava flows at • Cordon del Azufre Source location
Lastarria fumaroles in … Photo by M. Simons Photo by J. Naranjo Late 1980’s 2002 No fumaroles at Lazufre Photo by M. Simons
Visualizing volcano deformation What we would like to know: -How deep is the magma chamber? -How much magma might be moving? (Assuming that in is magma movement and not just a pressure/phase change) Cross-section Map view
Vary shape of “magma chamber” All sources have similar vertical deformation • Data are subject to multiple interpretations! • Bottom line: • With only one component of deformation: all shapes can fit data, but have different inferred depths and volume change • Consider: • Spherical point source • Prolate ellipsoid (football) • Oblate ellipsoid (frisbee) • Finite sphere … But horizontal deformation different Dieterich & Decker, 1975
Effects of source geometry on inferred depth Pritchard and Simons, G-cubed, 2004
Monitoring all the volcanic arcs in the world • Can we survey this arc? • Green: Yes, deformation measured • Yellow: Maybe, data is available • Red: Not yet, need more data Pritchard and Simons, GSA Today, 2004
From: Lu et al., 2000 Alaska/Aleutians From: Lu et al., 2003 From: Lu et al., 2003 From: Lu et al., 2003 From: Lu et al., 2001 From: Lu et al., 2004 • 9 deforming volcanoes • Subsiding pyroclastic flow • Eruptions with no deformation • Studies are ongoing From: Lu et al., 2003
Global Synthesis: What have we learned from InSAR? • Volcano life cycle: • Magmatic intrusions w/o eruption might be frequent and short-lived • These intrusions are mostly aseismic • Implications for hazard • Magma plumbing • Image spatial complexity of deformation (or lack of complexity) • Non-magmatic deformation • Lava flow and pyroclastic flow subsidence • Geothermal areas • Eruptions with no deformation observed • Maybe chambers are deep • Maybe chambers quickly refill • Different rates of activity in different arcs
Inter-arc comparison Arc # volcanoes # with historic # with eruptions # of volcanoes eruptions this decade actively deforming C. Andes 65 17 4 3-4 Alaska/ 80 46 17 81 Aleutians • Although Alaska/Aleutian arc seems more active, geologic averaged magma flux about the same (Reymer and Schubert, 1984) • Central Andes different because of 70 km thick crust or magma composition? • Or amount of sediment subducted? • Or type of lava (basalt vs. andesite/dacite)? • No single global explanation for the inter-arc variation in magma flux (Simkin and Siebert, 1984) 1Based on published work of Lu et al. 1997-2002
Summary and Future directions InSAR and pixel tracking major advance over point measurements of deformation New phenomena and sources of deformation discovered: Magma movements at supposedly dormant volcanoes “Silent” earthquakes Power-law viscoelastic response to large earthquakes Poro-elastic response to large earthquakes Dynamic acceleration of icesheets in response to surface melting Antropogenic deformation Near term developments (next 5-10 years): 1) Larger datasets (detect smaller deformation rates) 2) Extracting information from discontinuous images 3) Dedicated U.S. InSAR satellite? Maybe around another planet first? Longer term: Constellations of satellites Geostationary InSAR?: Near real-time capability Subsidence in New Orleans before Katrina measured by “permanent scatterers” From: Dixon et al., 2006
Planetary InSAR SAR images require Gigabytes -- hard to image entire planets, especially distant ones Mars: Repeat pass InSAR is possible (can control baseline to 100 m however orbit knowledge is limited to about 5-10 m requiring baseline determination from SAR data directly: Paul Rosen & Scott Hensley, JPL) Moon: Difficult to control orbits, useful for topographic mapping Mars InSAR mission concept: Paillou et al., 2001 Europa/Io: Difficult radiation environment & orbit control Titan: Cassini Radar (0.4-1.7 km pixel resolution; Ku band, 2 cm), but no repeating orbits yet - burst mode operation makes interferometry unlikely. Synthetic interferogram of tidal strain at crack on Europa S-band (13 cm) in 1000 km orbit. Thin Shell (3-30 km, with crack through most of it. (Sandwell et al., 2004)