Download
1 / 9
90 likes | 470 Views
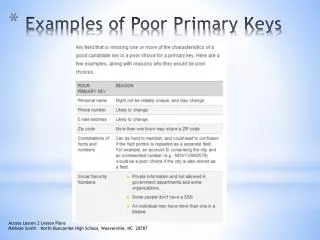
Examples of Poor Power Point Practice. The Practitioners’ Guide to HEA. Chapter 5: Translating Outcomes into Action, Annex D. Juxtaposing Poverty & Aid Traps. The labels on this graphic are impossible to read. Poverty Traps in S. Africa

E N D
Examples of Poor Power Point Practice The Practitioners’ Guide to HEA Chapter 5: Translating Outcomes into Action, Annex D
Juxtaposing Poverty & Aid Traps The labels on this graphic are impossible to read Poverty Traps in S. Africa • Look at changes over time in asset bundles measured in Poverty Line Units (PLUs) • Key findings: • Divergent dynamics • Repelling ‘Micawber Threshold’ at ~2 PLUs • Poverty trap equilibrium at 0.9 PLUs • Shocks & Productive Safety Net at the Micawber Threshold Source: Adato, M., M.R. Carter and J. May (2006), “Exploring Poverty Traps and Social Exclusion in South Africa Using Qualitative and Quantitative Data”, J of Development Studies, 42 (2): 226-247.
Civil Insecurity IDPs There is too much information on this page • AWD Case Fatality Rate (%) Unacceptable Levels (>2%) Combined with Concentrated Displacement (May 3, 2007) • Galgadud, Dhuusamareeb (3.4%) • Hiran, Belet Weyne (3.6%) • Shabelle, Marka (3.4%,) Afgoye (5.3%), Brava (2.6%) • Loss of Livelihoods, Income & Assets Combined with Sharp Food Price Increases (between mid-March & end April) • Import CommoditiesLocal Cereal • Central 11-25% no change • M. Shabelle 25-50% 9% • L. Shabelle 15-60% 15-40% • Hiran20-25%no change • Bay 25-60% 40-160%
The title font is too small Too many ‘messages’
These are talking points for the presenter, not bullet points for a slide
This table is not possible to read Footnotes: Baidoa & Qansahdhere prices have increased dramatically due to a)high demand for sorghum from neighbouring regions. b)Increased supply of cash both Dollars and Somali shillings. C)They are the only cereal markets currently accessible for traders to purchase due to rains blocking roads to other markets. Note that sorghum prices in all markets including Baidoa are still lower than the long term average (98-07). April '07 maize prices in Lower & Middle Shabelle are still lower than the April prices since 2004. Source: 2005 Population data - UNDP Somalia Displaced Populations - UNHCR 4 May 2007 AWD cases,Deaths & CFR - WHO 1 jan - 3 May 2007 Market Prices - FSAU
There is too much information on this slide – better as a hand out
The National Solidarity Programme • Rural Reconstruction and Development project Implemented by MRRD • 4 years from 2003 to 2007 • Funding and Assistance from World Bank and International Donors • Covering all Provinces of Afghanistan • 3 phases each year, covering averagely 16 villages in each ”batch”1st year: 5506 CDCs elected, and ongoing facilitation in 5917 Villages • Planned target, end of the project by 2007: 20.000 villages in the whole country • Main Objectives: • Reducing Poverty through Reconstruction and Development with Equal and Inclusive Participation – Gender, Ethnicity, Wealth and Social Status • Improved Local Governance with Empowerment of the People through Inclusive Participation in Reconstruction and Development • Building Institutions on Local Level and Linkage with the Sub-Government Structures • Learning Democracy through Participatory Co-operation and Shared Responsibility in the Planning of Community Development The font size on this slide is too small – there is too much text
Service Delivery The text colour choice is poor – not enough contrast with background making it hard to read Local Government seeks to provide much-needed services and peace dividends to its people. In order to meet this goal, it needs to: • Provide its communities with a secure environment • Improve its own capacity to jointly identify, plan, prioritize, implement and monitor/evaluate humanitarian, recovery and development projects with its communities and partners • Coordinate existing UN and NGO activities (“service delivery”) • Reduce its dependency on external support through a gradual process of fund raising, capacity building, absorption & direct execution of projects