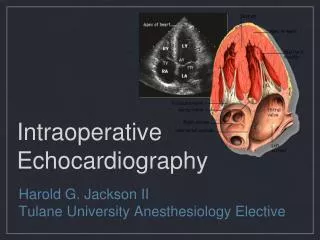
Echocardiography
380 likes | 645 Views
Echocardiography. Right Ventricular Systolic Function. Evaluation of RV Systolic Function. Quantitative Approach Difficult – 3D reconstruction tedious and time consuming. No standard geometric formulas for volume calculations. Evaluation of RV Systolic Function. Qualitative

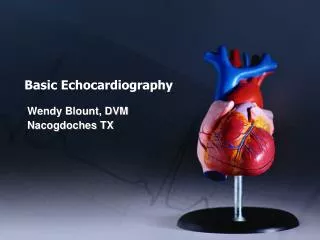
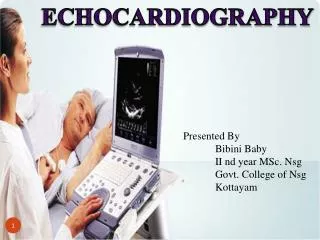
Echocardiography
E N D
Presentation Transcript
Echocardiography Right Ventricular Systolic Function
Evaluation of RV Systolic Function Quantitative Approach • Difficult – 3D reconstruction tedious and time consuming. • No standard geometric formulas for volume calculations.
Evaluation of RV Systolic Function Qualitative • Sufficient for clinical decision making Several Windows • PLAX • PSAX • RVIT • Apical 4 chamber • Subcostal 4 chamber
Evaluation of RV Systolic Function In each view evaluate • Area of RV (compare with LV) • Shape or RV cavity • RVWT • Degree of motion of RVFW • Pattern of septal motion
Evaluation of RV Systolic Function RV ventricle chamber • No simple geometric shape • Wraps around the LV in a U-shaped manner
Evaluation of RV Systolic Function Divided into 3 segments • Inflow – medial to LV • Body and apex – anterior to the LV • Outflow – superior to LV and aortic valve.
Evaluation of RV Systolic Function In apical and subcostal 4 chamber views the RV is: • Triangular in shape – broad base and narrow apex. • Apex closer to base than LV by about 1/3 of the LV length
Evaluation of RV Systolic Function RV Dilation • RVOT enlarged in PLAX • In apical and subcostal views – RV will be larger and RV apex either closer to or encompasses the LV apex
Evaluation of RV Systolic Function RV dilation • Normal response of RV to volume overload • Search for etiology: - ASD - TR - PR - Long standing pressure overload
Evaluation of RV Systolic Function RV hypertrophy • RVFW > 0.5 cm • Normal response of RV to pressure overload • Search for etiology: - Pulmonary stenosis - Pulmonary hypertension
Evaluation of RV Systolic Function RV hypertrophy • Wall thickening also seen in: - infiltrative cardiomyopathies - hypertrophic cardiomyopathy
Evaluation of RV Systolic Function Pattern of Septal Motion Diastole PSAX • RV is circular • Normal septal curvature convex to the RV and concave to the LV
Evaluation of RV Systolic Function Systole • Septal thickening • Septum moves towards the center of the LV • Shows circular LV chamber at the end of systole
Evaluation of RV Systolic Function Septal Motion • Septum moves toward the center of mass of the entire heart. • Center of mass of the entire heart is the center of the LV
Evaluation of RV Systolic Function RV mass = LV Mass • No septal motion
Evaluation of RV Systolic Function RV mass > LV mass • Septum moves anteriorly during systole (paradoxical septal motion) • Flattens or reverses its curvature in diastole (2-D echo)
Evaluation of RV Systolic Function Pressure Overload • Maximum reverse curvature occurring at the end of systole. Volume overload • Maximum reversed curvature is seen in mid-diastole.
Evaluation of RV Systolic Function SPAP = RVSP = 4( TRjet)2 + RAP
Evaluation of RV Systolic Function PA velocity Curve Normal • Slower acceleration • Longer time from onset of flow to peak flow • Rounded velocity curve
Evaluation of RV Systolic Function As Pulmonary Vascular Resistance increases: • The PA velocity curve approximates the LV ejection curve. • Rapid acceleration • Short time from flow onset to maximum velocity. • Sharper curve
Evaluation of RV Systolic Function A logarithmic relation between the time from onset of flow to peak velocity and mean pulmonary arterial pressure has been constructed.
Evaluation of RV Systolic Function IVRT • Time interval between PV closure and TV opening. • Pulmonary hypertension is associated with prolongation of the RV IVRT. • Measure IVRT with M-mode or Doppler. • Compare with Normograms.