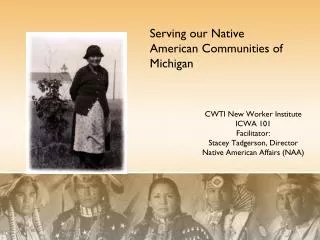
Dentist Serving Native Communities:
Dentist Serving Native Communities:. Sources of Satisfaction. Joseph P. Kelly, DDS MCH Research Festival June 7, 2006. Longest history of health care for the underserved Demanding dental practice situations Similar conditions of employment to other programs

Dentist Serving Native Communities:
E N D
Presentation Transcript
Dentist Serving Native Communities: Sources of Satisfaction Joseph P. Kelly, DDS MCH Research Festival June 7, 2006
Longest history of health care for the underserved Demanding dental practice situations Similar conditions of employment to other programs Includes rural and urban practice sites Dental caries prevalence in American Indian/Alaska Native children is among the highest in the world. Why survey dentists who serve American Indian/Alaska Natives?
Untreated Dental Caries by Poverty Status (Health, United States 2004) *
IHS Dentist Workforce Vacant Positions
Specific Aims 1) Identify characteristics of the dentists currently serving AI/AN populations and determine proportion intending to remain. 2) Identify factors associated with the initial decision to work with underserved AI/AN populations. 3) Explore individual- and environment-related factors in relationship to their intention to remain. 4) Explore of the dentists’ intention to remain in relationship to their attitudes, perceptions, and evaluation of this experience.
Survey 98-item mailed survey - Multiple choice, Likert type, and Open-ended questions - Ten domains Study population: - 525 dentists - All twelve IHS Service Areas Data entered manually using StatPac-Gold & MS Excel Analysis using Intercooled Stata 8.2
Survey of Dentists Serving Native Communities – 2005 Response 354/525 = 67.4% National Response Rates by Area Billings 26/36=72.2% Bemidji 24/28=85.7% Aberdeen 22/25=88.0% Portland 40/56=71.4% California 37/68=54.4% Phoenix 37/51=72.6% Nashville 15/21=71.4% Navajo 47/72=65.3% Tucson 5/7=71.4% Alaska 32/53=60.4% Albuquerque 24/37=64.9% Oklahoma 42/68=61.8%
Primary Reason for I/T/U Choice n=230 Felt a mission to underserved 61 (26.5%) Lifestyle and recreational opportunities 26 (11.3%) Possibility of loan repayment 26 (11.3%) Intention to Remain n=351 266 (75.8%) Career Decision Making
Median age at time of survey n=348 45 (26-78) yr Gender Male n=350 271 (77.4%) Female 79 (22.6%) Practice dentistry > ten years 236 (67.4%) Intend to Remain Older age (p<0.001) More years practicing dentistry (p<0.001) Had school-aged children during service (p<0.001) Personal & Professional Characteristics
I/T/U Practice Characteristics Median I/T/U Practice Years n=348 7 yrs (0-34) Intend to Remain Employed as other than civil servant (p<0.001) Dental director or specialist (p<0.001) Post-doctoral training in general dentistry (p<0.01) More experience in native community dentistry (p<0.001)
Program - Community size 351 Urban area (More than 50,000) 93 (26.5%) Micropolitan (10,000 to 49,999) 73 (20.8%) Small town (2500 to 9,999) 79 (22.5%) Rural (Less than 2500) 106 (30.2%) Intend to remain Positive assessment of dental staff (p<0.001) Reported less restriction on professional freedom related to: Patient compliance (p=0.01), Budgetary restraints (p<0.01), IHS levels of service (p<0.001) Dental Program Characteristics
DSS-Short scale Intention=Yes Intention = NoItem n=266 n=85 Sources of Dental Satisfaction by Intention to Remain Serving Native Communities Overall DSS-Short score* 254 57.5 (12.7) 80 53.5 (12.7) Interpersonal patient care 264 74.5 (21.6) 85 71.2 (22.7) Practice Management 262 68.7 (19.4) 81 67.0 (20.1) Delivery of quality care* 265 67.5 (27.2) Medical liability environment 265 67.2 (27.2) 85 66.2 (27.7) Supervisor support 263 65.8 (29.1) Income to support family* 264 63.5 (26.0)
Satisfaction with Life Scale Cronbach’s alpha= 0.85 Intend to Remain Intend to Leave SWLS Overall 259 64.8 (19.4) 85 56.3 (18.5) p<0.001 Dental Attitudes toward the UnderservedCronbach’s alpha= 0.81 Intend to Remain Intend to Leave DATU Overall 260 74.8 (17.8) 83 69.5 (17.8) p=0.02 Native Community Practice ExperienceCronbach’s alpha= 0.78 Intend to Remain Intend to Leave NCPE Overall 256 71.2 (13.0) 82 60.4 (12.7) p<0.0001 Perception and Evaluation of Experience Scoresby Intention to Remain
Project Mentors & Collaborators Thesis Committee: Christine Riedy, PhD, MPH – Chair Colleen Huebner, PhD, MPH Wendy Mouradian, MD, MS Doug Schaad, PhD IHS NOHC Advisory Group: Woody Crow, DDS, MPH Michael Crutcher, DDS Partial Funding of this Project by: U.S. DHHS, HRSA, Maternal and Child Health Bureau: Maternal and Child Health Program Grant # T76MC00011-21-00 Center for Leadership Training in Pediatric Dentistry Grant # 1T17MC00020-01 U.S. DHHS, HRSA, DSCPH, Bureau of Health Professions: “Enhancing Health Care in Western Washington’s Rural Areas” Grant # 1D36HP10027 UW Department of Pediatric Dentistry
Questions ? Photos by Don Doll ,SJ
Questions? Photos by Don Doll,SJ
Survey of Dentists Serving Native Communities Joseph Kelly, DDS University of Washington MCH Research Festival June 7, 2006