Download
1 / 11
110 likes | 179 Views
Explore key features of Commonwealth Fund proposals and the impact of the new health reform law on uninsured individuals, young adults, small businesses, and older adults. Learn about tax credits, access to care, and the financial burdens faced by Americans.

E N D
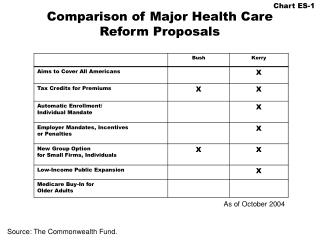
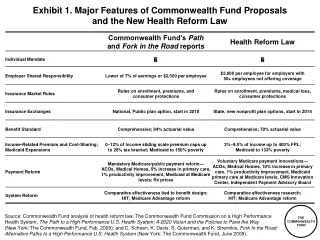
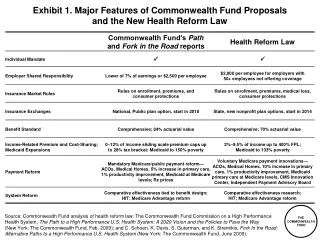
Exhibit 1. Major Features of Commonwealth Fund Proposals and the New Health Reform Law Source: Commonwealth Fund analysis of health reform law; The Commonwealth Fund Commission on a High Performance Health System, The Path to a High Performance U.S. Health System: A 2020 Vision and the Policies to Pave the Way(New York: The Commonwealth Fund, Feb. 2009); and C. Schoen, K. Davis, S. Guterman, and K. Stremikis, Fork In the Road: Alternative Paths to a High Performance U.S. Health System (New York: The Commonwealth Fund, June 2009).
Exhibit 2. Trend in the Number of Uninsured Nonelderly, 2013–2019Before and After Health Reform Millions Note: The uninsured includes unauthorized immigrants. With unauthorized immigrants excluded from the calculation, nearly 94% of legal nonelderly residents are projected to have insurance under the new law. Source: The Congressional Budget Office, Letter to the Honorable Nancy Pelosi, Mar. 20, 2010, http://www.cbo.gov/doc.cfm?index=11379.
Exhibit 3. Uninsured Young Adults Most Likely to Have Cost-Related Access Problems and Medical Bill or Debt Problems in the Past Year Percent of adults ages 19–29 reporting cost-related access problems or medical bill or debt problems: Notes: Access problems include not filling a prescription; skipping a medical test, treatment, or follow-up; having a medical problem but not seeing a doctor or going to a clinic; not seeing a specialist when needed; and delaying or not getting needed dental care. Medical debt or bill problems include not being able to pay medical bills; being contacted by a collection agency; changing way of life to pay medical bills; and medical bills/debt being paid off over time. Source: S. R. Collins and J. L. Nicholson, Rite of Passage: Young Adults and the Affordable Care Act of 2010(New York: The Commonwealth Fund, May 2010).
Exhibit 4. Small Business Tax Credits Under Affordable Care Act for Family Premiums Credit per employee $9,435—projected family premium 50% employer contribution $4,718* * To be eligible for tax credits, firms must contribute 50% of premiums. Firms receive 35% and later 50% of their contribution in tax credits. Note: Projected premium for a family of four in a medium-cost area in 2009 (age 40). Premium estimates are based on actuarial value = 0.70. Actuarial value is the average percent of medical costs covered by a health plan. Small businesses are eligible for new tax credits to offset their premium costs in 2010. Tax credits will be available for up to a two-year period, starting in 2010 for small businesses with fewer than 25 employees and with average wages under $50,000. The full credit will be available to companies with 10 or fewer employees and average wages of $25,000, phasing out for larger firms. Eligible businesses will have to contribute 50 percent of their employees' premiums. Between 2010–13, the full credit will cover 35 percent of a company's premium contribution. Beginning in 2014, the full credit will cover 50 percent of that contribution. Tax-exempt organizations will be eligible to receive the tax credits, though the credits are somewhat lower: 25 percent of the employer's contribution to premiums in 2010–13 and 35 percent beginning in 2014. Source: Commonwealth Fund analysis of Affordable Care Act (Public Law 111-148 and 111-152). Premium estimates are from the Henry J. Kaiser Family Foundation Health Reform Subsidy Calculator, http://healthreform.kff.org/Subsidycalculator.aspx.
Exhibit 5. More Than One-Quarter of Adults Under Age 65 with Medical Bill Burdens and Debt Were Unable to Pay for Basic Necessities Percent of adults ages 19–64 with medical bill problemsor accrued medical debt Source: S. R. Collins, J. L. Kriss, M. M. Doty, and S. D. Rustgi, Losing Ground: How the Loss of Adequate Health Insurance Is Burdening Working Families—Findings from the Commonwealth Fund Biennial Health Insurance Surveys, 2001–2007 (New York: The Commonwealth Fund, Aug. 2008).
Exhibit 6. More Than One-Third of Older AdultsReport Medical Bill Problems Percent of adults ages 50–70 with any medical bill problems or outstanding medical debt* * Problems paying/not able to pay medical bills, contacted by a collection agency for medical bills, had to change way of life to pay bills, or has medical debt being paid off over time. Source: S. R. Collins, K. Davis, C. Schoen, M. M. Doty, S. K. H. How, and A. L. Holmgren, Will You Still Need Me? The Health and Financial Security of Older Americans (New York: The Commonwealth Fund, June 2005).
Exhibit 7. Only 65 Percent of Adults Report Having an Accessible Personal Clinician Percent of adults ages 19–64 with an accessible primary care provider* U.S. Average U.S. Variation 2005 * An accessible primary care provider is defined as a usual source of care who provides preventive care, care for new and ongoing health problems, referrals, and who is easy to get to. Data: B. Mahato, Columbia University analysis of Medical Expenditure Panel Survey. Source: The Commonwealth Fund Commission on a High Performance Health System, Why Not the Best? Results from the National Scorecard on U.S. Health System Performance, 2008 (New York: The Commonwealth Fund, July 2008).
Exhibit 8. Three of Four Adults Have Difficulty Getting Timely Access to Their Doctor Getting an appointment with a doctor the same or next day when sick, without going to ER Getting advice from your doctor by phone during regular office hours Getting care on nights, weekends, or holidays without going to ER Any of the above Percent reporting that it is very difficult/difficult: Source: S. K. H. How, A. Shih, J. Lau, and C. Schoen, Public Views on U.S. Health System Organization: A Call for New Directions (New York: The Commonwealth Fund, Aug. 2008).
Exhibit 9. Doctors Use of Electronic Patient Medical Records Percent Note: Not including billing systems. Source: C. Schoen, R. Osborn, M. M. Doty, D. Squires, J. Peugh, and S. Applebaum, “A Survey of Primary Care Physicians in 11 Countries, 2009: Perspectives on Care, Costs, and Experiences,” Health Affairs Web Exclusive, Nov. 5, 2009, w1171–w1183.
Your specialist did not receive basic medical information from your primary care doctor Your primary care doctor did not receive a report back from a specialist Test results/medical records were not available at the time of appointment Doctors failed to provide important medical information to other doctors or nurses you think should have it No one contacted you about test results, or you had to call repeatedly to get results Any of the above Exhibit 10. Nearly Half of U.S. Adults Report Failures to Coordinate Care Percent U.S. adults reported in past two years: Source: S. K. H. How, A. Shih, J. Lau, and C. Schoen, Public Views on U.S. Health System Organization: A Call for New Directions (New York: The Commonwealth Fund, Aug. 2008).
Exhibit 11. Physicians in U.S. Less Likely to Receive Incentives for Quality or Meeting Goals Percent of physicians reporting any financial incentive for targeted care or meeting goals* * Can receive financial incentives for any of six: high patient satisfaction ratings, achieve clinical care targets, managing patients with chronic disease/complex needs, enhanced preventive care (includes counseling or group visits), adding non-physician clinicians to practice and non-face-to-face interactions with patients. Source: C. Schoen, R. Osborn, M. M. Doty, D. Squires, J. Peugh, and S. Applebaum, “A Survey of Primary Care Physicians in 11 Countries, 2009: Perspectives on Care, Costs, and Experiences,” Health Affairs Web Exclusive, Nov. 5, 2009, w1171–w1183.