ICHEP 2014
ICHEP 2014. Tevatron Energy Scan: Findings & Surprises. Rick Field University of Florida. Outline of Talk. CDF data from the Tevatron Energy Scan. The overall event topology for events with at least 1 charged particle.

ICHEP 2014
E N D
Presentation Transcript
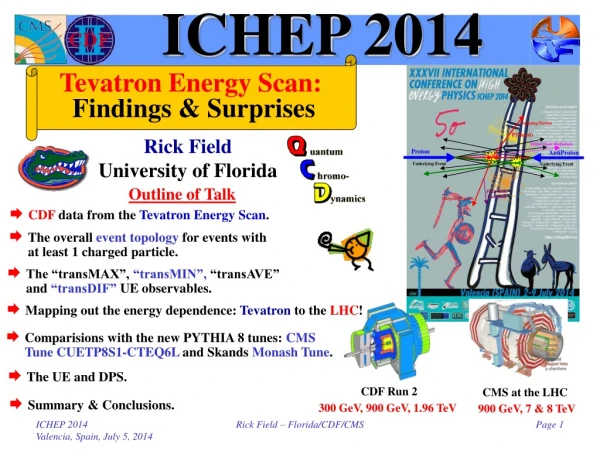
ICHEP 2014 Tevatron Energy Scan: Findings & Surprises Rick Field University of Florida Outline of Talk • CDF data from the Tevatron Energy Scan. • The overall event topology for events with at least 1 charged particle. • The “transMAX”, “transMIN”, “transAVE” and “transDIF” UE observables. • Mapping out the energy dependence: Tevatron to the LHC! • Comparisions with the new PYTHIA 8 tunes: CMS Tune CUETP8S1-CTEQ6L and Skands Monash Tune. • The UE and DPS. CDF Run 2 CMS at the LHC • Summary & Conclusions. 300 GeV, 900 GeV, 1.96 TeV 900 GeV, 7 & 8 TeV Rick Field – Florida/CDF/CMS
Tevatron Energy Scan • Just before the shutdown of the Tevatron CDF has collected more than 10M “min-bias” events at several center-of-mass energies! 900 GeV 300 GeV 1.96 TeV 300 GeV 12.1M MB Events 900 GeV 54.3M MB Events Rick Field – Florida/CDF/CMS
“Hard Scattering” Component QCD Monte-Carlo Models:High Transverse Momentum Jets • Start with the perturbative 2-to-2 (or sometimes 2-to-3) parton-parton scattering and add initial and final-state gluon radiation (in the leading log approximation or modified leading log approximation). “Underlying Event” • The “underlying event” consists of the “beam-beam remnants” and from particles arising from soft or semi-soft multiple parton interactions (MPI). The “underlying event” is an unavoidable background to most collider observables and having good understand of it leads to more precise collider measurements! • Of course the outgoing colored partons fragment into hadron “jet” and inevitably “underlying event” observables receive contributions from initial and final-state radiation. Rick Field – Florida/CDF/CMS
Jet Observables • “Toward” Charged Particle Density: Number of charged particles (pT > 0.5 GeV/c, |h| < 0.8) in the “toward” region (not including PTmax) as defined by the leading charged particle, PTmax, divided by the area in h-f space, 2hcut×2p/3, averaged over all events with at least one particle with pT > 0.5 GeV/c, |h| < hcut. • “Toward” Charged PTsum Density: Scalar pT sum of the charged particles (pT > 0.5 GeV/c, |h| < 0.8) in the “toward” region (not including PTmax) as defined by the leading charged particle, PTmax, divided by the area in h-f space, 2hcut×2p/3, averaged over all events with at least one particle with pT > 0.5 GeV/c, |h| < hcut. • “Away” Charged Particle Density: Number of charged particles (pT > 0.5 GeV/c, |h| < 0.8) in the “away” region as defined by the leading charged particle, PTmax, divided by the area in h-f space, 2hcut×2p/3, averaged over all events with at least one particle with pT > 0.5 GeV/c, |h| < hcut. • “Away” Charged PTsum Density: Scalar pT sum of the charged particles (pT > 0.5 GeV/c, |h| < 0.8) in the “away” region as defined by the leading charged particle, PTmax, divided by the area in h-f space, 2hcut×2p/3, averaged over all events with at least one particle with pT > 0.5 GeV/c, |h| < hcut. hcut = 0.8 Rick Field – Florida/CDF/CMS
UE Observables • “transMAX” and “transMIN” Charged Particle Density: Number of charged particles (pT > 0.5 GeV/c, |h| < 0.8) in the the maximum (minimum) of the two “transverse” regions as defined by the leading charged particle, PTmax, divided by the area in h-f space, 2hcut×2p/6, averaged over all events with at least one particle with pT > 0.5 GeV/c, |h| < hcut. • “transMAX” and “transMIN” Charged PTsum Density: Scalar pT sum of charged particles (pT > 0.5 GeV/c, |h| < 0.8) in the the maximum (minimum) of the two “transverse” regions as defined by the leading charged particle, PTmax, divided by the area in h-f space, 2hcut×2p/6, averaged over all events with at least one particle with pT > 0.5 GeV/c, |h| < hcut. hcut = 0.8 Overall “Transverse” = “transMAX” + “transMIN” Note: The overall “transverse” density is equal to the average of the “transMAX” and “TransMIN” densities. The “TransDIF” Density is the “transMAX” Density minus the “transMIN” Density “Transverse” Density = “transAVE” Density = (“transMAX” Density + “transMIN” Density)/2 “TransDIF” Density = “transMAX” Density - “transMIN” Density Rick Field – Florida/CDF/CMS
“transMIN” & “transDIF” • The “toward” region contains the leading “jet”, while the “away” region, on the average, contains the “away-side” “jet”. The “transverse” region is perpendicular to the plane of the hard 2-to-2 scattering and is very sensitive to the “underlying event”. For events with large initial or final-state radiation the “transMAX” region defined contains the third jet while both the “transMAX” and “transMIN” regions receive contributions from the MPI and beam-beam remnants. Thus, the “transMIN” region is very sensitive to the multiple parton interactions (MPI) and beam-beam remnants (BBR), while the “transMAX” minus the “transMIN” (i.e. “transDIF”) is very sensitive to initial-state radiation (ISR) and final-state radiation (FSR). “TransMIN” density more sensitive to MPI & BBR. “TransDIF” density more sensitive to ISR & FSR. 0 ≤ “TransDIF” ≤ 2×”TransAVE” “TransDIF” = “TransAVE” if “TransMIX” = 3×”TransMIN” Rick Field – Florida/CDF/CMS
PTmax UE Data • CDF PTmax UE Analysis: “Towards”, “Away”, “transMAX”, “transMIN”, “transAVE”, and “transDIF” charged particle and PTsum densities (pT > 0.5 GeV/c, |h| < 0.8) in proton-antiproton collisions at 300 GeV, 900 GeV, and 1.96 TeV (R. Field analysis). • CMS PTmax UE Analysis: “Towards”, “Away”, “transMAX”, “transMIN”, “transAVE”, and “transDIF” charged particle and PTsum densities (pT > 0.5 GeV/c, |h| < 0.8) in proton-proton collisions at 900 GeV and 7 TeV (Mohammed Zakaria Ph.D. Thesis, CMS PAS FSQ-12-020). • Old CMS UE Tunes: PYTHIA 6.4 Tune Z1 (CTEQ5L) and PYTHIA 6.4 Tune Z2* (CTEQ6L) and PYTHIA 8 Tune 4C* (CTEQ6L). All 3 were tuned to the CMS leading chgjet “transAVE” UE data at 900 GeV and 7 TeV. Similar to Tune 4C by Corke and Sjöstrand! Rick Field – Florida/CDF/CMS
Total Number of Charged Particles Overall average number of charged particles (including all PTmax values). • CDF data at 1.96 TeV, 900 GeV, and 300 GeV on the total number of charged particles (including PTmax) as defined by the leading charged particle (PTmax) for charged particles with pT > 0.5 GeV/c and |h| < 0.8. The data are corrected to the particle level with errors that include both the statistical error and the systematic uncertainty. Rick Field – Florida/CDF/CMS
Total Number of Charged Particles • CMS and CDF data on the total number of charged particles (including PTmax) as defined by the leading charged particle (PTmax) for charged particles with pT > 0.5 GeV/c and |h| < 0.8. The data are corrected to the particle level with errors that include both the statistical error and the systematic uncertainty. Rick Field – Florida/CDF/CMS
“Associated” Charged Particle Density • Corrected CDF data at 1.96 TeV, 900 GeV, and 300 GeV on the “associated” charged particle density in the “toward”, “away”, and “transverse” regions as defined by the leading charged particle (PTmax) for charged particles with pT > 0.5 GeV/c and |h| < 0.8. The data are corrected to the particle level with errors that include both the statistical error and the systematic uncertainty. The data are compared with PYTHIA Tune Z1. Rick Field – Florida/CDF/CMS
“Associated” Charged Particle Density • Corrected CDF data at 1.96 TeV, 900 GeV, and 300 GeV on the “associated” charged particle density in the “toward”, “away”, and “transverse” regions as defined by the leading charged particle (PTmax) for charged particles with pT > 0.5 GeV/c and |h| < 0.8. The data are corrected to the particle level with errors that include both the statistical error and the systematic uncertainty. The data are compared with PYTHIA Tune Z1. Rick Field – Florida/CDF/CMS
“Associated” Charged PTsum Density • Corrected CDF data at 1.96 TeV, 900 GeV, and 300 GeV on the “associated” charged PTsum density in the “toward”, “away”, and “transverse” regions as defined by the leading charged particle (PTmax) for charged particles with pT > 0.5 GeV/c and |h| < 0.8. The data are corrected to the particle level with errors that include both the statistical error and the systematic uncertainty. The data are compared with PYTHIA Tune Z1. Rick Field – Florida/CDF/CMS
“transMAX/MIN” NchgDen • Corrected CDF data at 1.96 TeV, 900 GeV, and 300 GeV on the charged particle density in the “transMAX” and “transMIN” regions as defined by the leading charged particle (PTmax) for charged particles with pT > 0.5 GeV/c and |h| < 0.8. The data are corrected to the particle level with errors that include both the statistical error and the systematic uncertainty. The data are compared with PYTHIA 6.4 Tune Z1 and Tune Z2*. Rick Field – Florida/CDF/CMS
“transMAX/MIN” NchgDen • Corrected CMS data at 7 TeV and CDF data at 1.96 TeV, 900 GeV, and 300 GeV on the charged particle density in the “transMAX” region as defined by the leading charged particle (PTmax) for charged particles with pT > 0.5 GeV/c and |h| < 0.8. The data are corrected to the particle level with errors that include both the statistical error and the systematic uncertainty. The data are compared with PYTHIA Tune Z1 and Tune Z2*. • Corrected CMS data at 7 TeV and CDF data at 1.96 TeV, 900 GeV, and 300 GeV on the charged particle density in the “transMIN” region as defined by the leading charged particle (PTmax) for charged particles with pT > 0.5 GeV/c and |h| < 0.8. The data are corrected to the particle level with errors that include both the statistical error and the systematic uncertainty. The data are compared with PYTHIA Tune Z1 and Tune Z2*. Rick Field – Florida/CDF/CMS
“transDIF/AVE” NchgDen • Corrected CMS data at 7 TeV and CDF data at 1.96 TeV, 900 GeV, and 300 GeV on the charged particle density in the “transDIF” region as defined by the leading charged particle (PTmax) for charged particles with pT > 0.5 GeV/c and |h| < 0.8. The data are corrected to the particle level with errors that include both the statistical error and the systematic uncertainty. The data are compared with PYTHIA Tune Z1 and Tune Z2*. • Corrected CMS data at 7 TeV and CDF data at 1.96 TeV, 900 GeV, and 300 GeV on the charged particle density in the “transAVE” region as defined by the leading charged particle (PTmax) for charged particles with pT > 0.5 GeV/c and |h| < 0.8. The data are corrected to the particle level with errors that include both the statistical error and the systematic uncertainty. The data are compared with PYTHIA Tune Z1 and Tune Z2*. Rick Field – Florida/CDF/CMS
“transMAX” NchgDen vs Ecm • Corrected CMS data at 7 TeV and CDF data at 1.96 TeV, 900 GeV, and 300 GeV on the charged particle density in the “transMAX” region as defined by the leading charged particle (PTmax) for charged particles with pT > 0.5 GeV/c and |h| < 0.8. The data are corrected to the particle level with errors that include both the statistical error and the systematic uncertainty. • Corrected CMS and CDF data on the charged particle density in the “transMAX” region as defined by the leading charged particle (PTmax) for charged particles with pT > 0.5 GeV/c and |h| < 0.8 with 5 < PTmax < 6 GeV/c. The data are plotted versus the center-of-mass energy (log scale). Rick Field – Florida/CDF/CMS
“Transverse” NchgDen vs Ecm <transMIN> = 4.7 <transMAX> = 2.7 • Corrected CMS data at 7 TeV and CDF data at 1.96 TeV, 900 GeV, and 300 GeV on the charged particle density in the “transMAX” and “transMIN” regions as defined by the leading charged particle (PTmax) for charged particles with pT > 0.5 GeV/c and |h| < 0.8 with 5 < PTmax < 6 GeV/c. The data are plotted versus the center-of-mass energy (log scale). • Ratio of CMS data at 7 TeV and CDF data at 1.96 TeV, 900 GeV, and 300 GeVto the value at 300 GeV for the charged particle density in the “transMAX” and “transMIN” regions as defined by the leading charged particle (PTmax) for charged particles with pT > 0.5 GeV/c and |h| < 0.8 with 5 < PTmax < 6 GeV/c. The data are plotted versus the center-of-mass energy (log scale). The data are compared with PYTHIA Tune Z1 and Tune Z2*. Rick Field – Florida/CDF/CMS
“TransMIN/DIF” vs Ecm The “transMIN” (MPI-BBR component) increases much faster with center-of-mass energy than the “transDIF” (ISR-FSR component)! Duh!! <transMIN> = 5.7 <transMIN> = 4.7 <transDIF> = 2.2 <transDIF> = 2.6 • Ratio of CMS data at 7 TeV and CDF data at 1.96 TeV, 900 GeV, and 300 GeVto the value at 300 GeV for the charged particle density in the “transMIN”, and “transDIF” regions as defined by the leading charged particle (PTmax) for charged particles with pT > 0.5 GeV/c and |h| < 0.8 with 5 < PTmax < 6 GeV/c. The data are plotted versus the center-of-mass energy (log scale). • Ratio of CMS data at 7 TeV and CDF data at 1.96 TeV, 900 GeV, and 300 GeVto the value at 300 GeV for the charged PTsum density in the “transMIN”, and “transDIF” regions as defined by the leading charged particle (PTmax) for charged particles with pT > 0.5 GeV/c and |h| < 0.8 with 5 < PTmax < 6 GeV/c. The data are plotted versus the center-of-mass energy (log scale). The data are compared with PYTHIA Tune Z1 and Tune Z2*. Rick Field – Florida/CDF/CMS
“Tevatron” to the LHC CMS CDF CDF CDF Tune Z2* & 4C* Rick Field – Florida/CDF/CMS
“Tevatron” to the LHC CMS CDF CDF CDF Tune Z2* & 4C* Rick Field – Florida/CDF/CMS
New UE Tunes arXiv:1307.5015 [hep-ph] • New Herwig++ Tune: M. Seymour and A. Siódmok have used the CDF UE data at 300 GeV, 900 GeV, and 1.96 TeV together with LHC UE data at 7 TeV to construct a new and improved Herwig++ tune. arXiv:1404.5630 [hep-ph] • New PYTHIA 8 Monash Tune: P. Skands, S. Carrazza, and J. Rojo have used the CDF UE data at 300 GeV, 900 GeV, and 1.96 TeV together with LHC data at 7 TeV to construct a new PYTHIA 8 tune (NNPDF2.3LO PDF). CMS-PAS-GEN-14-001 • New CMS UE Tunes: CMS has used the CDF UE data at 300 GeV, 900 GeV, and 1.96 TeV together wth CMS UE data at 7 TeV to construct a new PYTHIA 6 tune (CTEQ6L) and two new PYTHIA 8 tunes (CTEQ6L and HERAPDF1.5LO PDF). Rick Field – Florida/CDF/CMS
“Tevatron” to the LHC CMS • Shows the “transAVE” charged PTsum density as defined by the leading charged particle, PTmax, as a function of PTmax at 300 GeV, 900 GeV, 1.96 TeV, and 7 TeV compared with the Skands Monash tune. CDF CDF CDF • Shows the “transAVE” charged particle density as defined by the leading charged particle, PTmax, as a function of PTmax at 300 GeV, 900 GeV, 1.96 TeV, and 7 TeV compared with the Skands Monash tune. Rick Field – Florida/CDF/CMS
“Tevatron” to the LHC • Shows the “transAVE” charged particle density as defined by the leading charged particle, PTmax, as a function of PTmax at 300 GeV, 900 GeV, 1.96 TeV, and 7 TeV compared with the CMS tune CUETP8S1-CTEQ6L. • Shows the “transAVE” charged PTsum density as defined by the leading charged particle, PTmax, as a function of PTmax at 300 GeV, 900 GeV, 1.96 TeV, and 7 TeV compared with the CMS tune CUETP8S1-CTEQ6L. Excludes the 300 GeV data! Rick Field – Florida/CDF/CMS
Predictions at 13 TeV Rick Field – Florida/CDF/CMS
Predictions at 13 TeV Rick Field – Florida/CDF/CMS
DPS and the “Underlying Event” Having determined the parameters of an MPI model, one can make an unambiguous prediction of seff. In PYTHIA 8 seff depends primarily on the matter overlap function, which for bProfile = 3 is determined by the exponential shape parameter, expPow, and the MPI cross section determined by pT0 and the PDF. Multiple parton interactions (MPI)! 1/(pT)4→ 1/(pT2+pT02)2 “Underlying Event” “Underlying Event” DPS: Double Parton Scattering Most of the time MPI are much “softer” than the primary “hard” scattering, however, occasionally two “hard” 2-to-2 parton scatterings can occur within the same hadron-hadron. This is referred to as double parton scattering (DPS) and is typically described in terms of an effective cross section parameter, seff, defined as follows: Independent of A and B where sA and sB are the inclusive cross sections for individual hard scatterings of type A and B, respectively, and sAB is the cross section for producing both scatterings in the same hadron-hardon collision. If A and B are indistinguishable, as in 4-jet production, a statistical factor of ½ must be inserted. Rick Field – Florida/CDF/CMS
20-30 mb Sigma-Effective • Shows the seff values caluclated from the PYTHIA 8 Monash and CMS tune CUETP8S1-CTEQ6L. PYTHIA 8 predicts an energy dependence for seff! New D0 values The seff predicted from the PYTHIA 8 UE tunes is slightly larger than the direct measurements! HERWIG++ Tune UE-ee-5-CTEQ6L1 seff≈ 15 mb! Rick Field – Florida/CDF/CMS
Summary & Conclusions What we are learning should allow for a deeper understanding of MPI which will result in more precise predictions at the future LHC energies of 13 & 14 TeV! • The “transverse” = “transAVE” region is not a true measure of the energy dependence of MPI since it receives large contributions from ISR and FSR. • The “transMIN” (MPI-BBR component) increases much faster with center-of-mass energy than the “transDIF” (ISR-FSR component)! Previously we only knew the energy dependence of “transAVE”. • PYTHIA 6.4 Tune Z1 & Z2* and PYTHIA 8 Tune 4C* do a fairly good job in describing the energy deperdence of the UE, however there is room for improvement! The parameterization PT0(Ecm) = PT0(Ecm/E0)e seems to work! • New tunes are being constructed that describe both the UE and DPS within the same formalism. Stay tuned! We now have at lot of MB & UE data at 300 GeV, 900 GeV, 1.96 TeV, and 7 TeV! We can study the energy dependence more precisely than ever before! Rick Field – Florida/CDF/CMS