Download
1 / 16
160 likes | 180 Views
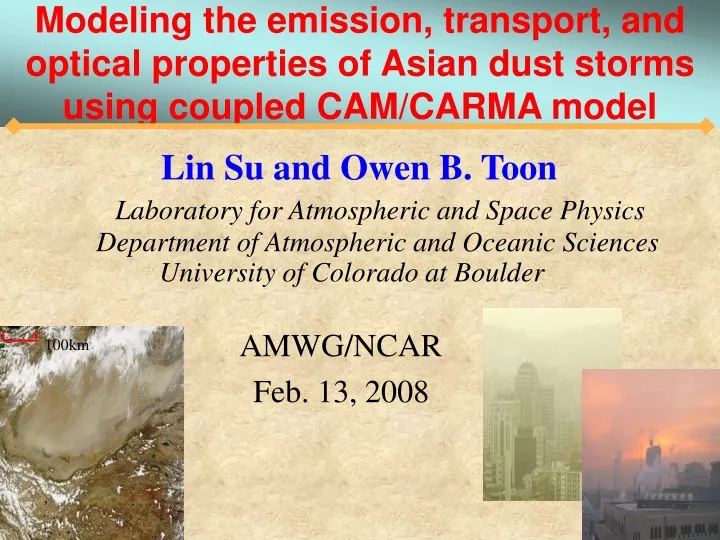
Modeling the emission, transport, and optical properties of Asian dust storms using coupled CAM/CARMA model. Lin Su and Owen B. Toon Laboratory for Atmospheric and Space Physics Department of Atmospheric and Oceanic Sciences University of Colorado at Boulder AMWG/NCAR

E N D
Modeling the emission, transport, and optical properties of Asian dust storms using coupled CAM/CARMA model Lin Su and Owen B. Toon Laboratory for Atmospheric and Space Physics Department of Atmospheric and Oceanic Sciences University of Colorado at Boulder AMWG/NCAR Feb. 13, 2008 100km
Outline • Model configuration • Modified dust source function • Sub-grid scale velocity distribution • Effective dry deposition velocity • Transport and optical properties • Summary • Future work
Model descriptions • CAM3(NCAR Community Atmosphere Model) • CARMA2.3(the University of Colorado/NASA Community Aerosol and Radiation Model for Atmospheres) • Finite Volume dynamical core • Horizontal resolution: 2 x 2.5 degrees • 28 vertical model layers • Ginoux et al. [2001] dust lifting scheme • 8 dust size bins (ranging from 0.1-10 um radius)
NCEP Reanalysis Initialization Meteorology fields CAM3 Advection Convection Boundary layer mixing Wet deposition Dry deposition CARMA2.3 state Emission Sedimentation tendencies Model output Dust MMR Dust concentration AOD SSA Extinction, etc.
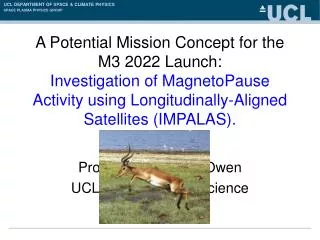
RUSSIA Gobi Beijing JAPAN Taklimakan CHINA 10/27/2001
Wind Field Under unstable, neutral and stable conditions Friction Velocity Replace u10
Sub-grid scale velocity distribution The Ginoux et al. [2001] dust source functions has the form: (1) Following Gillette and Passi [1988], after integrated formula (1) from the threshold wind velocity to infinity, we got the Weibull distribution of the dust lifting schemes as follows: The shape factor and scale factor following Grini and Zender [2004] Where is the incomplete gamma function given by
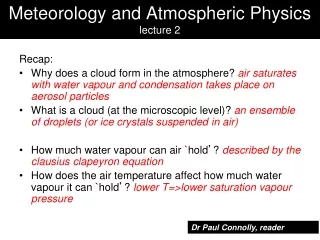
The ratio of dust emission w/ weibull wind distribution and w/o weibull wind distribution (April 7, 2001)
Dust Dry Deposition Process The dry deposition velocities - following Seinfeld & Pandis [1998]: The eqn. in Seinfeld and Pandis don't produce the correct gradients when the fall velocity is large. They are derived incorrectly when falling is occurring. Account for soil moisture: the effective dry deposition velocity - Ginoux et al. [2001]:
Single Scattering Albedo for Dunhuang, China on April 07, 2001 Observation and model simulation is 0.947and 0.920 at 550nm South Asia: 0.90 at 532nm[Muller et al., 2003] Sahara Desert: < 0.90 at 550nm[Takemura et al., 2002; Sokolik and Toon, 1999]
Summary • I modified Ginoux et al. [2001] dust source function by using the friction velocity instead of the 10-meter wind based on the wind erosion theory and saltation physical process. • I introduced the Weibull wind distribution to use sub-grid scale velocity distribution, and results in up to 1.25 times of dust lifting. • The aerosol optical depths and single scattering albedo • agree with the ground-based AERONET retrievals. However, I haven’t included air pollutants from China. • The vertical profiles of dust are comparable to the ACE- • Asia 2001 NIES-lidar observations in Beijing.
FutureWork Compare the results with new satellite retrievals (MODIS Deep-Blue) and for other time periods (PACDEX). Constrain dust height by MISR stereo plume product and CALIPSO lidar data. Run the model in an offline mode at higher resolution using the GEOS-5 DAS at 0.5x0.666 degrees. 3. Study the relationship between drought cycles and dust storms in Asia area