ALC 208 Week 6- TOPIC 5 Sampling
230 likes | 259 Views
Learn about purposive and random sampling, errors in research, types of sampling, and when to use probability or non-probability sampling methods.

ALC 208 Week 6- TOPIC 5 Sampling
E N D
Presentation Transcript
ALC 208Week 6- TOPIC 5Sampling Assigned Readings: TEXT: Chapter 6 & Reading 5.1: Purposive Sampling & Random Numbers Table (emailed)
Sampling • Pollsters got it wrong in the: • - 2004 US and Australian Elections • -2008 US Presidential Primaries in New Hampshire • Didn’t get it right either for the: • -2008 & 2012 US Presidential elections as very close • -1936 Presidential Election by the Literary Digest with 2 million respondents • Variations in figures by different polling companies are caused by issues related to sampling, questions posed to subjects and other factors
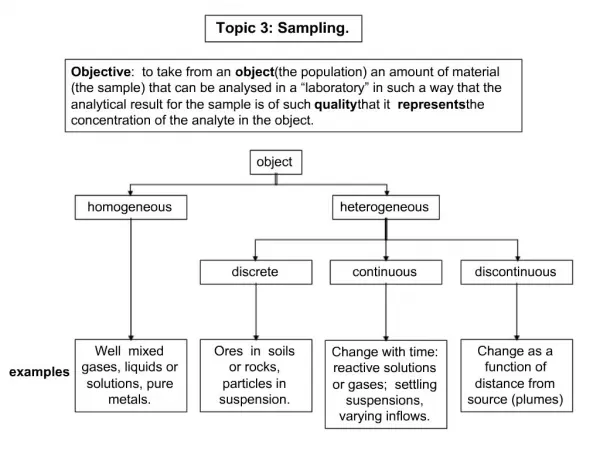
Samples & Populations • Not possible to study everyone all the time. • A Population- All relevant members • A census- Like an inventory of everyone /all • A sample- Used to make estimations of the population. ‘Clothing samples’, shoes displayed in a shop • A Representative sample- represents all subsets of the population • A Non-representative sample- Does not represent all subsets of population
Errors in the research Process & Findings • Measurement error- Errors in the instrument. E.g Survey, content analysis coding manual, interview questions posed to subjects. Can occur in any study. • Sampling error-How much the sample differs from the population eg. Asking 1st year students about a new major and not year 12 students. The Literary Digest only read by rich Republicans- not all voters • Random error- Resulting due to unknown, unexpected or uncontrolled factors. e.g. Falklands War helped Thatcher; Tampa helped John Howard • Margin of error- Given as + or – 3 or 4% • -3___-2___-1__0__+1 __+2__+3 Gap is 6 • -4___________________0________________+4 Gap is 8 • If Gillard is 53% and Abbott is 45% in popularity with + or -4% margin, • the gap is 8%. So unless the gap is higher than 8%, it is ‘neck and neck’ or ‘too close to call’
Types of Sampling • Probability Sampling- selected according to mathematical guidelines- Draw lots to select 10% of students in class; Tossing a coin. • Helps calculate Sampling error. • Non-probability sampling- Not selected according to mathematical guidelines. Cannot calculate sampling error, findings not generalisable to the population.
When to use probability / Non-probability (NP) sampling • Depends on: • 1. Purpose of study- NP for exploratory studies • 2. Cost vs Value - budget and importance of project /data • 3. Time constraints – NP when in a hurry and for preliminary information • 4. Level of acceptable error- NP for pilot studies, if control of error is not important • Rule of Thumb: Use probability sampling when study is very important and results need to be generalised. • A probability sample does not guarantee representativeness. e.g randomly selected sample of 50 people for a TV study may draw 50 subjects with no TV at home.
Types of Non-Probability sampling • Convenience or available sample- readily available subjects. e.g. Students in a class, mall shoppers • -Suitable for exploratory studies, to check instrument etc. Findings not generalisable. • -Involves researcher subjectivity and sampling bias e.g. Choose friendly looking people • - Choosing every 10th person passing the researcher at the mall etc. does not make it random • -Law of Large Numbers- A very large sample also does not make it a probability sample.
Volunteer Samples -Anyone willing to participate when invited. E.g. SETUs; telephone /Internet voting for reality TV- Big Brother; mail surveys • - Sample not representative as volunteers are very different from others. They are more educated, high status, more intelligent, altruistic, less authoritarian (not bossy) etc. • -May lead to supporting researcher’s hypothesis and skewed results. • -Radio/TV/Internet polls only available to those with the technology and if tuned in at the time. e.g. Literary Digest poll only available to its readers in 1936 • -Some claim all research subjects are ‘volunteers’ due to ethics requirement of ‘voluntary participation’.
Purposive Samples • -Sample ‘fits the purpose’ of study. • -Eliminates those not fitting criteria • e.g. Casting directors of reality TV shows use the method (See Reading 5.1) • -Often used in advertising e.g. Wearers of eye glasses • - Method used by journalists when interviewing people for a news story.
Quota Sampling • -Similar to purposive sampling but uses known and predetermined percentages from various groups in the population. e.g. 50% men & 50% women. • Snowball Sampling (referrals) • -Common in academic research • -Contact one or few suitable subjects and ask them to recommend others • - May only find people of same circle, network etc and not a diverse group. • -Best when seeking subjects with rare characteristics. Eg. Ask AkmalSaleh when seeking other Muslim comedians.
Types of Probability Sampling • Random Sampling- Each subject has equal chance of being included. e.g. Raffle • Random Sampling without replacement- When the first subject drawn is NOT put back into the draw before the next is drawn. Probability may reduce as selection goes on. E.g. 1/1000. 1/999, 1/998 etc. Most often used system. • Random Sampling with replacement- When the first subject drawn is put back into the draw before the next is drawn. Helps maintain probability the same throughout. e.g.1/1000. Used in nationwide surveys.
Random Numbers Tables • Tells us the order for using random numbers. • can be generated usinghttp://www.randomizer.org. • Indicate size of population and size of sample. • Random digit dialling • Used in telephone surveys to call people selected at random. • Use computer generated random digits for the last four numbers, select the suburb prefix, then the state prefix. Eg. (03) 2711234 etc • - But this includes silent, non-existent and discontinued numbers. Need three times the numbers needed to call.
Sampling Frame • The complete list of members of the population used when selecting a sample. E.g. Deakin internal directory of staff; Callista database that lists all students. • A Telephone directory is incomplete as it does • not include silent numbers or list everyone in a home with a landline or include those without landlines.
Systematic random Sampling • A system where every nth subject or unit is selected from a population (N) for the sample (S). • Calculate the sampling interval n= N/S • Randomly select the starting point (e.g. 8) and select the nth subject thereafter from the sampling frame. e.g. If n=6, the subjects selected will be 8; (8+6)= 14; (14+6)= 20; (20+6)= 26 etc. till you have your 20 subject sample.
Cyclicity • A systematic random sample can end up ‘biased’ due to cyclicity if it involves a ‘cycle’ such as days of the week, months of the year etc. • e.g. If n= 7, we end up choosing newspapers of the same day of the week for the period under study; If n=12, we could choose magazines of the same month for the number of years of the study. • Therefore researchers use a composite week or year to select the sample from the period. • e.g. randomly choose a day of the week (say Thursday) and choose Thursday from week1, Friday from week 2 etc.
Periodicity • The way subjects are listed in the sampling frame can bias the selection of the sample, when using systematic random sampling. • e.g. In selecting a sample of movies for 2008 from the sampling frame, we could end up selecting films of the same genre or the same studio. This results in an unrepresentative sample. • e.g. In an alphabetical listing of names, common last names (say Smith) will have a better chance of being included as the sampling interval (n) can jump over the uncommon ones.
Stratified (Strata or Segment) Sampling • Guarantees that sufficient numbers of subjects from specific sub-samples in the population are represented in the sample, better than random sampling can and reducessampling error. • These strata can be based on sex, age, education, income etc. • e.g. Income groups of: below $35,000/year; $36-$60,000’ $61-$80,000; $81,000 or above
Proportionate Stratified sampling • Various groups in the sample are selected based on their proportion in the population. • E.g. If census figures indicate that 20% of the people earns less than $36,000/year, the sample will have the same percentage of subjects from that income group.
Disproportionate Stratified Sampling • Over sample or over represent a particular group in the sample if that stratum is important to the project. • E.g. Households earning over $100,000 to over represent a project related to luxury cars, as they are the ones who can afford the product.
Types of Sampling Used in Qualitative Research • Uses non-probability sampling and small samples • Findings not generalisable to the population • Provides useful and even unique insights and opinions of subjects • Generally uses purposive, snowball orconvenience samples • Type of subject, sampling method and sample size not finalised at the beginning • Data collection ends when saturation point is reached (no new info with additional interviews) • Quantitative research decides on sampling method, type of subject and sample size before data collection begins
Choosing Suitable Sample Size Optimal sample size- (The best under the circumstances) is the ‘smallest one possible and largest one necessary’ • No standard sample size recommended for specific research ,method or area of study’ • But some statistical analyses may require a minimum sample size. e.g. 300 surveys for a factor analysis; 6-12 for a focus group etc. • In a stratified sample, 50-100 sample size needed for each subset or strata e.g. Sex- 50 males/females each.
Sample size depends on: • Type of project (method used) • Purpose, complexity and amount of error that can be tolerated (low in medical research) • Time and financial constraints • Previous research in area • Size of budget (for private companies) • Sample size of 10-50 sufficient for pilot studies, pre-tests and for heuristic value • Recommended sample sizes by population (size) available, but different numbers given by different authors • Margin of sampling error significantly reduced by a larger sample only up to point, thereafter not proportionate with increased sample size • TV ratings research in USA (with over 300 million population) only uses a 3000-sized sample.