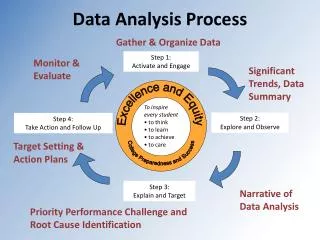
Six Steps of Data Analysis Process
Data analysis is the process of gathering, transforming, and organising data in order to draw conclusions, make future projections, and make data-driven decisions. Data analysts are the people that handle data analysis. Data analysts are in high demand due to the current rapid expansion of data. Potential solutions for a business problem are discovered using data analysis. Data analysts have the flexibility to work in any industry they want, including healthcare, agriculture, IT, finance,https://www.learnbay.co/data-science-course/data-science-courses-in-chennai/

Six Steps of Data Analysis Process
E N D
Presentation Transcript
Six Steps of Data Analysis Process
what is data analysis Data analysis is the process of gathering, transforming, and organising data in order to draw conclusions, make future projections, and make data-driven decisions.
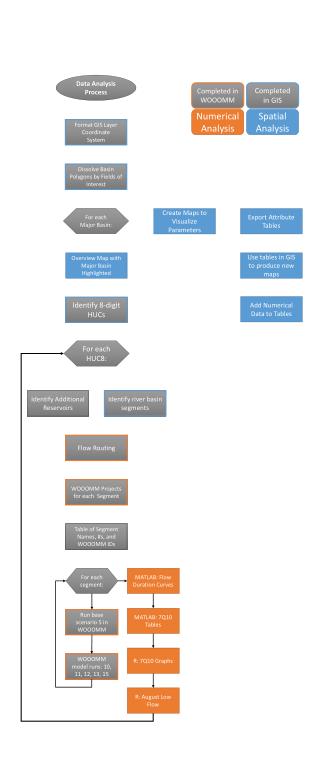
Ask or Specify Data Requirements Prepare or Collect Data Steps Clean and Process Analyze Share Act or Report
1.Ask or Specify Data Requirements Asking is the first step in the procedure. The business task or problem is delivered to the data analyst. The task and the stakeholder's expectations for the solution must be understood by the analyst. Anyone who has contributed money and resources to a project is considered a stakeholder. Finding the best answer to a problem requires the analyst to be able to ask many questions.
2. Prepare The preparation or collection of the data is the second step. Data collection and storage are steps included in this process for later analysis. The analyst must gather information from several sources in accordance with the assignment assigned. The information must be gathered from a variety of sources, whether internal or external. Data that is internal to the organisation you work for is known as internal data, and data that is external to your organisation is known as external data.
3. Clean and Process Data Process is step three. Cleaning the data is the next step once it has been gathered from various sources. Clean data is information that is devoid of typos, repetitions, and irrelevant information. Data integrity is mostly responsible for clean data. The redundant data is eliminated and cleaned because there may be duplicates or the data may not be in the proper format.
4. Analyze The analysis stage is the fourth. The cleansed data is utilised to conduct analysis and spot trends. In order to get better results, it also makes calculations and merges data. Excel or SQL are the programmes utilised to make the calculations. These tools offer built-in functions for performing computations, or example SQL code is supplied to do so. While SQL creates temporary tables to execute calculations, Excel allows us to build pivot tables and perform computations.
5. Share Share comes in at step five. There is nothing more persuasive than a visualisation. The converted data must now be turned into a graphic (chart, graph). Making data visualisations is necessary since non-technical stakeholders, who make up the majority of users, may be present. Visualizations are created to make difficult data easier to comprehend. The two widely used tools for creating eye-catching data visualisations are Tableau and Looker.
6. Act or Report Act is the sixth and last phase. Following a presentation of your findings, the stakeholders debate whether to proceed or not. If they accepted your suggestions, they proceeded with your remedies. If they disagree with your conclusions, you will need to look farther to uncover additional potential answers. It is necessary to reorganise each phase.
Thankyou for watching want to learn more about data science please visit our site www.learnbay.co/data-science-course/data-science-courses- in-chennai/