Download
1 / 32
320 likes | 452 Views
Spatially Explicit Burn Probability across A Landscape in Extreme Fire Weather Year. Wenbin Cui, David L. Martell Faculty of Forestry, University of Toronto. Outline. Burn Probability (BP) Model. BP Model Application Predict BP in an Extreme Fire Weather Year. Discussions

E N D
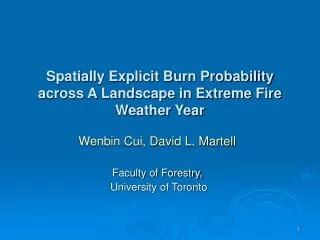
Spatially Explicit Burn Probability across A Landscape in Extreme Fire Weather Year Wenbin Cui, David L. Martell Faculty of Forestry, University of Toronto
Outline • Burn Probability (BP) Model • BP Model Application • Predict BP in an Extreme Fire Weather Year • Discussions • Possible Applications, Limitations & Future Research
Burn Probability Calculation • Forest Burn Probability of next fire season at location(i,j) • BPxy: Burn probability at location (x,y) • N: number of years(iterations) • Nxy: number of times of having been burned at location(i,j)
Fire Spread Main Factors affecting BP Fuel Type Weather Topography (elevation, slopes & slope aspects) Fire Occurrence Level of Protection
SPATIAL Burn Probability Model Fuel Type Fire Occurrence Burn Probability Level of Protection Fire Spread Daily Weather
Fuel Type Classification • The Canadian Forest Fire Behavior Prediction (FBP) System is used
Burn Probability Model Fuel Type Fire Occurrence Fire Occurrence Burn Probability Level of Protection Fire Spread Weather
Fire Occurrence • That total number of fires will occur each year follows a Poisson distribution with an average number equal to historical average number of fires in this landscape. • The conditions that cause past ignition pattern will continue in the next fire season • affected by the fuel at the location and the weather condition at the time of ignition. • Ignition Patterns differ by cause
Fire ignition patterns (density) • People-caused and Lightning-caused density maps
Burn Probability Model Fuel Type Fire Occurrence Burn Probability Level of Protection Level of Protection Fire Spread Weather
Level of Protection • Percent of forest fires controlled at initial attack (IA) • If a fire is controlled, it only “burns” one cell of the landscape. Otherwise it escapes IA and we used a fire growth model to “spread” it. • Escape Index: (EI) • HFI is the Head Fire Intensity (kW/m) • RT is response time (hours)
3 hours 2 hours Spatially Different Response Time to Forest Fires 4 hours 10 hours
Burn Probability Model Fuel Type Fire Occurrence Burn Probability Level of Protection Fire Spread Weather
Fire Spread • The escaped fires are simulated by using Wildfire program. • Wildfire is a fire growth model that incorporates GIS data, FBP System calculations and weather data to estimate patterns of hourly fire perimeters. (Todd 1999)
Burn Probability Model Fuel Type Fire Occurrence Burn Probability Level of Protection Fire Spread Weather Weather
Weather • Daily historical weather data • Each record includes: • Temperature, Relative Humidity, Wind speed, wind direction, rain fall, FFMC, DMC, DC, BUI, ISI • Data from more than one station can be used.
BP Maps Burn Fractions Fire Information Other Output of the Model BP Model
Application of BP Model in an Extreme Fire Weather Year • Study area • Application of the Model
FBP Fuel Types 2,028,224 ha
Fire History • From 1976 to 1999 there are 909 fires. • The average is 37.875/year. • The average area burned a year is 1136.15 ha.
Annual Burn Probability 0.0567%
Burn Probability in an Extreme Weather Year • What is an EXTREME Fire Weather Year? • The year that has most ESCAPED fires • Burned more area • 1991 • Average Number -75 (real number) • Daily Weather • LOP - 90.7% (Uniform response time)
Burn Probability under Extreme Weather Conditions (1991) 0. 258%
Response time (LOP) Fuel Management FireSmart Harvest Assessment & Decision FireSmart Roads Fuel Ignition People-caused ignition control Applications of Burn Probability Model BP Model
Used in other models • Forest Management Models (FireSmart) • Burn Probability by Stands • Burn Fractions by species, stand • WUI Fire Management • Wildlife Habitat Suitability Assessment
Limitations and Future Work • Spotting is not included in fire spread - Prometheus with spotting capability will be used in future • Use of Regional Climate Model • Produce more BP maps!
Acknowledgement Jennifer Johnson, Mike B. Wotton, Ana C. Espinoza, Mariam Sanchez G,Justin Podur and Jennifer Beverly Faculty of Forestry, University of Toronto Kelvin Hirsch, Victor Kafka, Marc-André Parisien, Bernie Todd Canadian Forest Service, Northern Forestry Center Jim Caputo, Robert McAlpine Ontario Ministry of Natural Resources Tembec Sustainable Forest Management Network
Thanks ! Comments & Questions?