Download
1 / 27
270 likes | 414 Views
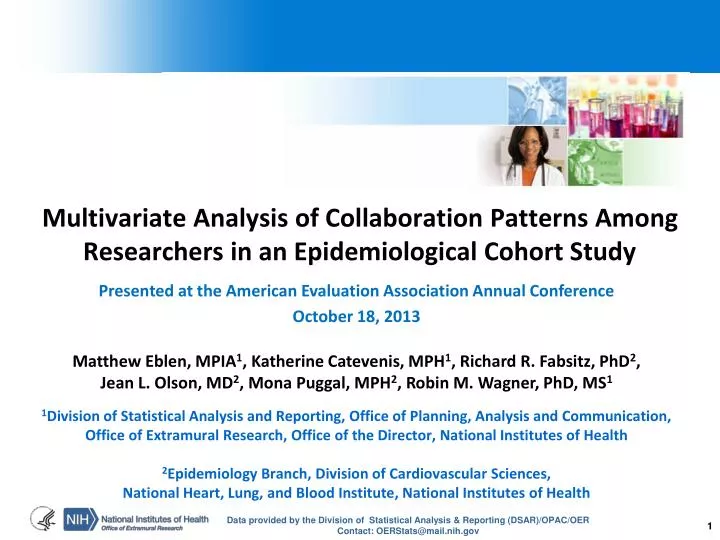
Multivariate Analysis of Collaboration Patterns Among Researchers in an Epidemiological Cohort Study. Presented at the American Evaluation Association Annual Conference October 18, 2013 Matthew Eblen , MPIA 1 , Katherine Catevenis, MPH 1 , Richard R. Fabsitz, PhD 2 ,

E N D
Multivariate Analysis of Collaboration Patterns Among Researchers in an Epidemiological Cohort Study Presented at the American Evaluation Association Annual Conference October 18, 2013 Matthew Eblen, MPIA1, Katherine Catevenis, MPH1, Richard R. Fabsitz, PhD2, Jean L. Olson, MD2, Mona Puggal, MPH2, Robin M. Wagner, PhD, MS1 1Division of Statistical Analysis and Reporting, Office of Planning, Analysis and Communication, Office of Extramural Research, Office of the Director, National Institutes of Health 2Epidemiology Branch, Division of Cardiovascular Sciences, National Heart, Lung, and Blood Institute, National Institutes of Health
Outline • Research Questions • Background on NHLBI-funded Cohort Study • Cardiovascular Health Study • Methods with Examples • Analysis • Summary • Next Steps
Research Questions • General Question: • What motivates researchers to collaborate with one another? • Specific Questions: • Are certain researcher characteristics associated with an increased likelihood to collaborate? • If so, can we measure the relative magnitude of these characteristics?
Cardiovascular Health Study Background • Cardiovascular Health Study (CHS): Started in 1988 to study development and progression of clinical coronary heart disease (CHD) and stroke in older adults • Cohort study funded by the National Heart, Lung, and Blood Institute (NHLBI) • Persons were recruited at 4 study field sites • Includes questionnaires, clinic exams, laboratory exams, and ongoing participant follow-up to identify clinical events • Includes occasional training events and a policy on data sharing • Information on journal articles associated with CHS, and published between 1990 – June 2011 was collected • Publications reported by study coordinating centers, augmented through PubMed searches • Co-author linkages identified
Methods - I *Eblen et al., Social network analysis comparing researcher collaborations in two cardiovascular cohort studies , Research Evaluation (2012) 21 (5): 392-405. doi: 10.1093/reseval/rvs030 • Builds on previous paper* applying social network analysis techniques to collaboration networks of two NHLBI-funded cohort studies, the CHS and Strong Heart Study • Two authors were said to have collaborated if they co-authored a publication together • Collaboration network was constructed using co-authorship linkages • Authors represented by nodes • Collaboration (co-authorship) caused a line to be drawn between collaborating authors • Network measures of density, diameter and centralization were calculated • Similar to traditional summary statistics
Example - I Here is one possible author collaboration network. author node instance of collaboration between two authors Density = 36% (16/45 = 36% of possible collaborations have occurred) This is the probability that two random authors in the network have collaborated.
Example - II Let color represent the author’s field of science. Estimates of how likely it is two authors collaborated will improve if their fields of science are known. e.g., if both authors are red there is a 90% chance they have collaborated (9/10 possible collaborations have occurred among red authors) General observations about this network: Red authors are more collaborative than blue authors (ten collaborations vs. seven collaborations). Both red and blue authors are more likely to collaborate with one another than with an author of the other field of science (only one collaboration between blue and red).
Example - III Let node size represent seniority (larger nodes = more seniority). The more seniority an author pair has, the more likely it is they collaborated. Are red authors more collaborative than blue authors? Or are high seniority authors more collaborative than low seniority authors? Or both? Exponential Random Graph Models (ERGMs) are designed to answer such questions.
Methods - II • Used ERGMs to estimate the likelihood that two CHS authors would collaborate • Similar to traditional multivariate logistic regression models • Dependent variable is the probability that two authors will collaborate given characteristics of the authors (independent variables) • Isolates the contribution of one characteristic on the likelihood of collaboration while “controlling” for all other characteristics • ERGMs were fitted with the Statnet package in R (3.0.1) • Also modeled the Strong Heart Study collaboration network, but results not presented here due to time constraints
Methods - III • CHS author characteristics included in ERGM • Continuous Variables • Publication Productivity • Average # of publications per year • Network Seniority • Number of years since entering the network • Categorical Variables • Role in Study: • PI: Funded Principal Investigator • Co-Investigator: Any non-PI paid staff member of study (or NHLBI staff involved in study) • Neither: No formal study affiliation
Methods – III (cont.) • Categorical Variables (cont.) • Primary Field of Science (FOS): • Authors coded to the field of science associated with the journal they published in most often • If authors published in two FOS journals an equal amount they were classified as “More Than One FOS” • Training Events • Data Analysis Workshop Attendance • NHLBI sponsored workshops for new junior investigators in 2005 and 2007 • Data Sharing • Utilization of NHLBI Data Repository Data Set • Annually updated de-identified data set available since 2000, which is easily distributed by NHLBI to any qualified investigator • Formerly known as Limited Access Data Set (LADS)
Methods - IV • For categorical variable characteristics, two types of estimates were calculated: • Sociality • The general propensity of authors of a particular category to collaborate, regardless of whom with • e.g., “red” authors were more collaborative than “blue” authors • If authors of a given pair differ in characteristic type, a different sociality estimate applies to each author in the pair • Assortative Mixing • The propensity of authors to collaborate specifically within their own categorical type • e.g., “red” authors were more likely to collaborate with “red” authors than with “blue” authors • An assortative mixing estimate only applies to author pairs that match on a particular characteristic
Methods – IV (cont.) • For continuous variable characteristics, two types of estimates were calculated: • Combined • Add together the values of both authors in the pair • E.g., the more combined years of seniority an author pair had, the more likely it is they collaborated • Similar to sociality • Difference • Subtract the values of the author pair from one another • E.g., the greater the difference in years of seniority between the author pair, the less likely it is they collaborated • Similar to assortative mixing
Methods – V • Estimates of characteristics (independent variables) shown in log odds (logit) form • Useful for showing the relative magnitude of each characteristic’s contribution to collaboration • 95% confidence intervals • Intervals that cross zero indicate the estimate is not statistically significant • Sociality estimates require a baseline reference group, assortative mixing estimates do not • Sociality considers all collaborative ties, so degrees of freedom are exhausted • Assortative mixing only considers collaborative ties within characteristic types, so degrees of freedom are not exhausted
CHS Collaboration Network Author Role in Study Red = Principal Investigator Orange = Co-Investigator Green= Neither # Authors = 1749 Density = 2%
Summary - I • Publication productivity and seniority were associated with more collaboration (co-authorship) in general (sociality) • However, highly productive and high seniority authors preferred to collaborate with other highly productive and high seniority authors (assortativemixing) • PIs and Co-Investigators tended to be more collaborative in general than other researchers (sociality) • There was no evidence that PIs and Co-Investigators preferred to collaborate exclusively with one another (noassortative mixing) • Some fields of science were more collaborative in general than others (sociality) • Fields that were more peripheral in subject matter to CHS tended to be less collaborative
Summary - II • All fields of science preferred to collaborate within their own field, though to varying degrees (assortative mixing) • Fields that were more peripheral in subject matter to CHS were more likely to collaborate exclusively with others in their own field • NHLBI events designed to encourage collaboration were effective (sociality) • Invitees who attended workshops and who participated in NHLBI’s data sharing program tended to be more collaborative in general than similar authors who did not
Next Steps • Greater knowledge of author characteristics would enhance the ability of ERGMs to identify the main drivers of collaboration • This methodology could be fruitfully combined with information on which co-authorships had greater impact (e.g., citation information) • ERGMs could estimate the factors associated with highly cited co-authorships • Results could suggest potential collaborating partners with a high likelihood of producing impactful publications • Knowledge gained could be integrated into design of new studies, building in or encouraging characteristics that would promote collaboration
Strong Heart Study Background • Strong Heart Study (SHS): Started in 1988 to estimate cardiovascular disease (CVD) mortality and morbidity, and prevalence of known and suspected CVD risk factors in American Indians • Includes 13 American Indian tribes and communities • Phoenix, Arizona • Southwestern Oklahoma • Western and central North and South Dakota • Required participants to be 45-74 years old at entry • Includes questionnaires, clinic exams, laboratory exams, and ongoing participant follow-up to identify clinical events • Strong Heart Family Study launched in 1998, includes family members of original participants to add genetic risk factors • Largest multi-center epidemiologic study of American Indians