Download
1 / 1
10 likes | 271 Views
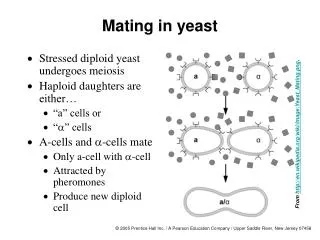
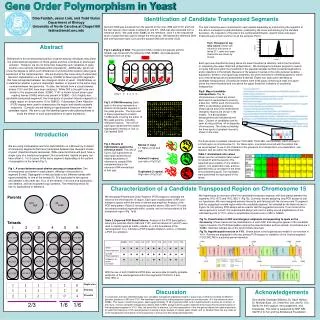
Gene Order Polymorphism in Yeast. Cy5. Cy3. 21A. S288C. S90. Y101. 21B. 21C. 21D. Array 1 2 3 4 5 6. *. *. Dina Faddah, Jason Lieb, and Todd Vision Department of Biology University of North Carolina at Chapel Hill fadina@email.unc.edu.

E N D
Gene Order Polymorphism in Yeast Cy5 Cy3 21A S288C S90 Y101 21B 21C 21D Array 1 2 3 4 5 6 * * Dina Faddah, Jason Lieb, and Todd Vision Department of Biology University of North Carolina at Chapel Hill fadina@email.unc.edu Identification of Candidate Transposed Segments Genomic DNA was extracted from the parents of the cross (S90 and Y101) and from the four spores in two tetrads (numbers 21 and 27). DNA was also extracted from a reference strain. We used strain S288C as the reference, since it is the sequenced strain of yeast that was used to design the microarray. We labeled the reference DNA with one fluorescent dye (Cy3) and the sample DNA with another (Cy5). The spot intensities were normalized for each sample separately by transforming the logarithm of the ratio to a standard normal distribution (subtracting the mean and dividing by the standard deviation). By inspection of the tails of the combined distribution, specific lower and upper threshold were chosen common to all the samples (Fig 5). Each spot was classified as being below the lower threshold (a deletion), within the thresholds, or surpassing the upper threshold (a duplication). We developed a computer program to search for spots that were within the thresholds in the parental samples but that contained duplications and/or deletions in the tetrads. Because of the apparent overlap in the ratios between putative duplication, deletion, and equal-copy segments, we were interested in identifying spots for which any of the tetrad spores exceeded either threshold. Eighty-four spots were identified as candidate transpositions. Of particular interest were three spots containing at least one spore below the lower threshold and one above the upper threshold, indicative of a potential transposition. Fig 5. Histogram of log ratio values. Shown are values for one spore of tetrad 27. Lower and upper thresholds are shown by arrows. Abstract Differences in the chromosomal position of genes among individuals may affect the transcriptional regulation of those genes and thus contribute to phenotypic variation. However, we do not know how frequently such variations in gene location occur among individuals within populations. Additionally, we do not know the degree to which such differences in chromosomal location affect gene expression at the transposed loci. We are studying this issue using Comparative Genomic Hybridization on a Microarray (CGHM) to detect genomic segments that have transposed between two divergent strains of yeast. CGHM allows us to determine whether a gene is duplicated, deleted, or present in the same copy number between two genomes. To date, two tetrads from a cross between strains Y101 and S90 have been analyzed. While S90 is thought to be very similar to the sequenced strain, S288C, Y101 is known to lack seven open reading frames (ORFs) which are present in S288C. Out of eighty-four candidate transposed segments, the three spots of greatest interest mapped to a single region on chromosome 15 (in S288C). Polymerase Chain Reaction (PCR) assays were used to characterize the region and identify probable endpoints. Currently, we are testing a hypothesized inversion within the candidate region. We aim to use the identified gene order polymorphisms to study the effects of such polymorphisms on gene expression. Fig 2. Labeling of DNA. The genomic DNA, including the parents and the tetrads, was mixed with the reference DNA, S288C, and subsequently hybridized onto an array. Fig 6. Map of candidate transpositions. The 16 chromosomes of yeast are shown. Each spot is represented to scale by a blue bar. Within each chromosome, ORFs on the Watson strand are shown above and Crick strand below; intergenic regions are shown in the middle. The 84 candidate transpositions are indicated by red bars. Clusters of candidates can be seen at nine positions, all on separate chromosomes. The clump containing the three spots of greatest interest is shown in the inset. Fig 3. A DNA Microarray. Each spot on the array represents a distinct chromosomal segment in the yeast genome. The chip used in these experiments contains 13,380 spots covering the entire 12 Mb yeast genome, including intergenic regions. The color of each spot represents the relative hybridization intensity of Cy3 vs. Cy5 labeled DNA. Introduction We are using Comparative Genomic Hybridization on a Microarray to detect chromosome segments that have transposed between two divergent strains of yeast (Saccharomyces cerevisiae). While parental strains will each have a single copy of a transposed segment, the recombinant haploid progeny can have either 0, 1 or 2 copies of the same segment, depending on the pattern of segregation in the tetrad (Fig 1). The three spots of greatest interest are IYOL160W, IYOL158C, and NORF60, which all map to a small region on chromosome 15. For these spots, one tetrad occurred with the pattern that we would expect to see in 2/3 of tetrads in the presence of a transposition (one duplication, one deletion, and two within the thresholds). Fig 4. Results of hybridization against the reference strain. The ratio of Cy3 to Cy5 signal seen at each spot represents the relative abundance of reference to sample DNA complementary to the reference DNA immobilized at that spot. Normal (1 copy) 1:1 Ratio of Cy3 and Cy5 Table 1. Normalized ratio values. Shown are the normalized ratio values for tetrad 27 and the parents. The expected spore pattern of one deletion (green), one duplication (red), and two parental ratios is consistent in the three most interesting spots. Two replicates were performed for each spore in the tetrad. Deleted (0 copies) Low ratio of Cy3:Cy5 Fig 1. A cross between yeast strains carrying a transposition. Two chromosomes are shown in each parent, differing in the position of segment B (red). Segregation in meiosis leads to six different tetrads with equal probability. In one of the tetrads (5), B is duplicated in two spores and deleted in the other two. Four of the tetrads (1-4) have one duplication, one deletion, and two expected copy numbers. The remaining tetrad (6) has no duplications or deletions. Duplicated (2 copies) High ratio of Cy3:Cy5 Characterization of a Candidate Transposed Region on Chromosome 15 We hypothesize an inversion within the candidate transposed segment, with boundaries between the segments IYOL157C and IYOL155C-1 (Fig.7b). Currently, we are designing long PCR assays to test our hypothesis. We have designed primers internal to and flanking both the chromosome 15 segment and the suggested inverted region within the candidate segment. As indicated by the black arrows in Figure 7b, two primary PCR assays will be used to test the suggested inversion. If our model of the rearrangement is correct, this experimental design will result in easily-scored amplifications of the indicated regions in Y101, while no amplification should occur in S90 or S288C. Parents We developed Polymerase Chain Reaction (PCR) assays to delineate the extent of the chromosome 15 region. Each open reading frame (ORF) and intergenic spacer within the area of interest was amplified. Analysis of the PCR band pattern (Table 2) among the parental strains (S90 and Y101) and two tetrads revealed segments within, outside, and on the boundaries of the transposed region (Fig. 7a/b). ABC DEF ABC DEF AC DBEF x Fig 7a. Classification of ORF and intergenic amplicons corresponding to spots on the microarray. Shown below are the classifications of each ORF and intergenic spacer in the candidate region, based on the PCR band pattern among the parental strains and two tetrads. Coordinates are in S288C. Asterisks indicate two of the spots initially observed. Table 2. Expected PCR Band Patterns. Analysis of the PCR band pattern among the parental strains (S90 and Y101) and two tetrads (21 and 27) were used to classify spots as inside, outside, or on the boundaries of the rearrangement. A (+) indicates a PCR sizeable amplicon, and a (-) indicates a PCR non-amplicon. Tetrads 3 4 5 6 2 1 Fig 7b. Hypothesized Inversion in Y101. Shown below is the hypothesized model for an inversion in Y101. Primers are displayed for the two primary PCR assays for validation of the inverted segment. IYOLCDELTA2 is a putative primer mismatch. ABC DEF ABC DBEF ABC DBEF ABC DEF ABC DEF ABC DBEF S288C Y101 S90 21A 21B 21C 21D 27A 27B 27C 27D ABC DBEF ABC DEF ABC DEF ABC DBEF ABC DEF ABC DBEF Within Rearrangement + + + - + + + - + + + a. Outside Rearrangement + + + + + + + + + + + AC DBEF AC DBEF AC DEF AC DBEF AC DEF AC DEF Endpoints, or primer mismatch + - + - - + + - + + - AC DEF AC DBEF AC DEF AC DEF AC DBEF AC DBEF With the use of both CGHM and PCR data, we were able to identify probable endpoints of the rearrangement within the segments IYOL161C-0 and IYOL155C-0. b. Discussion In conclusion, we have identified eighty-four candidate transposed segments present in equal copy number but located at different genomic positions in S90 and Y101. We identified a particularly striking segment located on chromosome 15 in the reference strain S288C. This region contains five genes, spans approximately 15 kB of genomic DNA, and is hypothesized to contain an inversion. In the future, contour-clamped homogeneous electric field (CHEF) analysis will be used to determine the exact chromosomal location of the transposed segment in Y101. Also, we would like to examine, (a) how transposition of the five genes affects their gene expression, (b) what the frequency of this rearrangement is among a larger sample of natural yeast strains, and (c) whether there are any clues as to the transposition mechanism in the sequences in and around the transposed segments. Acknowledgements Dina thanks Ostranda Williams, Dr. Sean Hanlon, Dr. Michael Buck , Dr. Cheol Koo Lee, and Dr. Eric Ganko for their support, encouragement, and knowledge. This work is supported by NSF DBI-0227314 to TJV and the Smallwood Foundation. 2/3 1/6 1/6