Download
1 / 18
180 likes | 330 Views
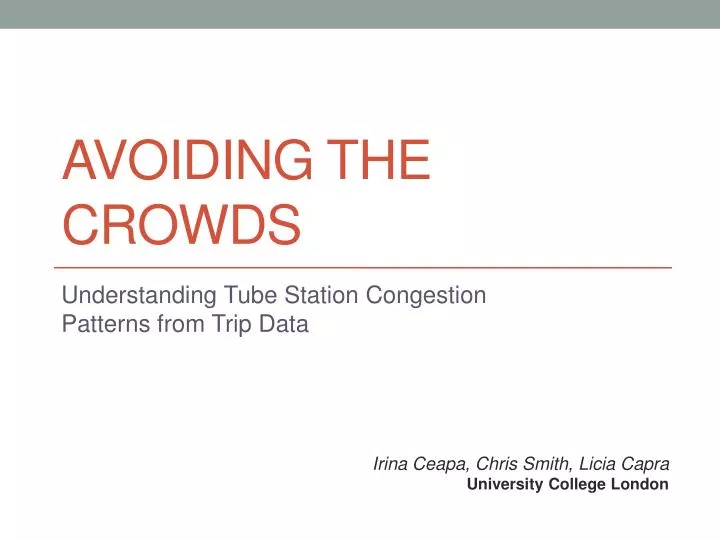
Avoiding the crowds. Understanding Tube Station Congestion Patterns from Trip Data. Irina Ceapa , Chris Smith, Licia Capra University College London. No one likes a crowded train. Encouraging off-peak travel. Fare differentiation doesn’t work. ( Lathia & Capra, Ubicomp 2011)

E N D
Avoiding the crowds Understanding Tube Station Congestion Patterns from Trip Data Irina Ceapa, Chris Smith, Licia Capra University College London
Encouraging off-peak travel • Fare differentiation doesn’t work. (Lathia& Capra, Ubicomp2011) • Personal requests from the mayor don’t work. • #f**koffboris
“In truth, to attain interior peace, one must be willing to pass through the contrary to peace.” • Swami Brahmananda • or, we all just need to get to work on time!
Proposal • Analysestation congestion patterns. • Predict congestion. • TODO: How can predictions benefit users of the system?
London Underground 31 days (23 weekdays) 270 stations 5 million travellers 64 million trips
Prediction • Classify a station as either overcrowded (above threshold) or not overcrowded (below threshold). • Predictors • Historic Value • Historic Mean • Historic Trend • Vary • threshold • prediction window • proportion of training data
Evaluation Sensitivity = • true positives • ------------------------------- • true positives + false negatives
Nudging • User study required to determine threshold. • different users may have different thresholds. • a single user may have different thresholds in different contexts. • User study required to asses potential for encouraging users to change travel time, and asses benefit (in terms of comfort) of change.
Limitations • We only have data pertaining to stations – predicting train congestion would be better. • Potentially victim of own success – if many people change travel habits, congestion will become much harder to predict.
Take homes • Crowdedness is highly regular and easy to predict • Congestion often occurs in brief spikes, suggesting that altering travel time by as little as 20 minutes could help travellers to avoid crowds. Thanks!