Download
1 / 8
80 likes | 97 Views
This project aims to improve science education by implementing inquiry-based lessons. The presentation includes background information, discussion of results, data collection methods, research questions, future projects, references, results, literature review, qualitative and quantitative data reporting, and acknowledgments. The focus is on sharing findings and implications for teaching practices.

E N D
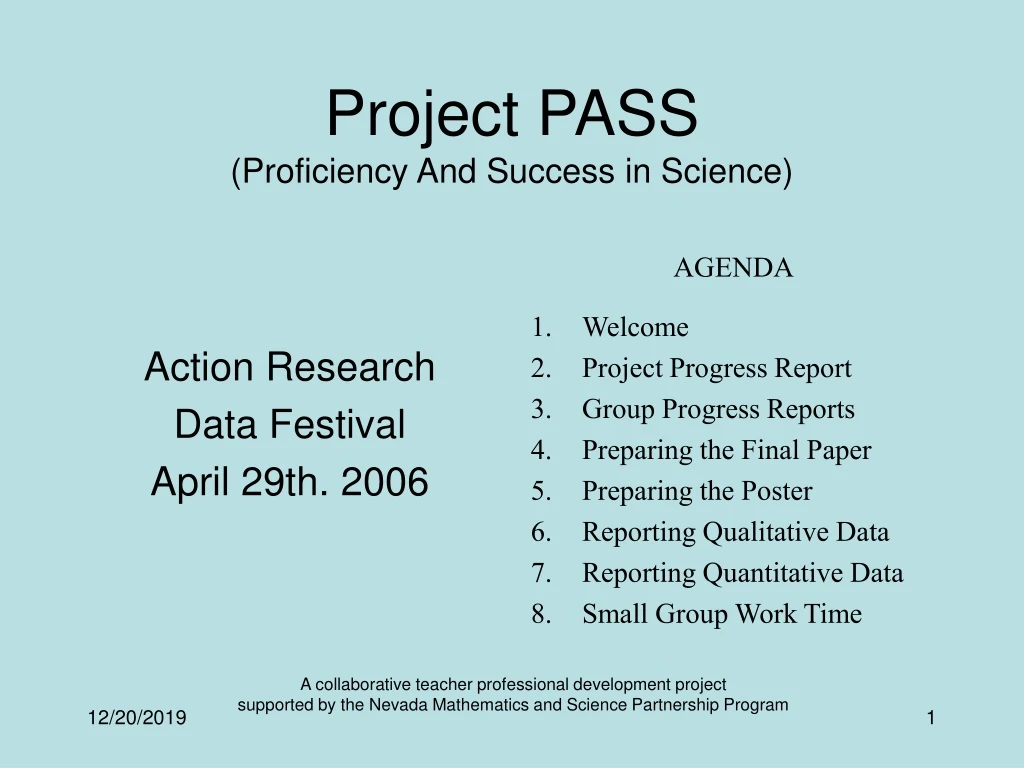
Action Research Data Festival April 29th. 2006 AGENDA Welcome Project Progress Report Group Progress Reports Preparing the Final Paper Preparing the Poster Reporting Qualitative Data Reporting Quantitative Data Small Group Work Time Project PASS(Proficiency And Success in Science) A collaborative teacher professional development project supported by the Nevada Mathematics and Science Partnership Program
Group Progress Reports Spend 5 minutes preparing an update to be presented to the whole group about the current status of your project.
Preparing the Final Paper • (10 double spaced pg. minimum) • Purpose • Questions • Basis for the Questions • Data Collection and Analysis • Results • Conclusion (alignment-address the research questions) • Reflection • Submitted electronically as MS Word files to Dr. Crippen via Interact by 5pm on Tuesday, May 9.
Title of Your Action Research Project Authors of the Presentation with School Affiliations Background: Tell the story of how you became interested in your project and why its important to you and your school. Discussion and Implications: Tell us what your results mean and how they can or should influence teaching. Do your results have any specific implications for your teaching? For other peoples’ teaching? Data: Tell us about what data you collected, how often you collected it, and how you expected your data to help you answer your research question. You may want to include examples of surveys, interview questions, pictures of students participating in the project, etc. off to the side of this slide so other people can see what you did (and to make the poster less boring!). Figure 1. Here is one of my students working on his inquiry project. Figure 3. Our inquiry project involved computers. Figure 2. Here’s what happened when my students worked on their inquiry projects. Our Research Question(s): Include your research questions so that the people viewing your poster know what you were studying in your classroom. Future Projects: Now that you’ve done this project, what do you see yourself doing in the future? References: Give references for papers you cite in the poster. Figure 4. Here’s one of our students researching for her presentation about astrophysics. Figure 5. This graph shows that student interest in science increased when we used inquiry lessons in our class. Results: Describe the basic results of your study. It will help if you include data, graphs, coding categories, quotations from interviews or log notes off to the side so the people who view your poster can see what you’re talking about (and it also helps to make the poster less boring). Literature: Tell us a little bit about what science educators already know about the topic you are studying and how your project adds to what is already known. John: “Wow. This inquiry lesson was really neat!” Susie: “I learned a lot during this lesson” Paul: “I liked coming to class when we were learning through inquiry!” Figure 6. Some of our favorite quotations from students who participated in the inquiry lessons. Acknowledgements: Briefly thank anyone who particularly helped you with your project. Figure 7. This figure shows the relationship between students’ grades and the percentage of student-centered activities in the classroom.
Presenting Qualitative Results • Identify and describe the themes or patterns (codes) you found in your data. • Your themes/patterns should align with and help you answer your Research Questions! • Consider presenting the codes in an order that makes sense (i.e., group similar codes, present codes in chronological order, present codes that address a particular research question together, etc.). • As you discuss your themes, give evidence (quotations, student artifacts, etc.) that backs up your discussion.
Discussing Qualitative Results • This is your time to share what you have learned from your research project. • Make sure you discuss the following in detail: • The “answers” to your research questions • Any connections between your codes/themes/patterns or any major discrepancies between them • Any implications of your results (for teaching, for future research, etc.)