Download
1 / 22
300 likes | 542 Views
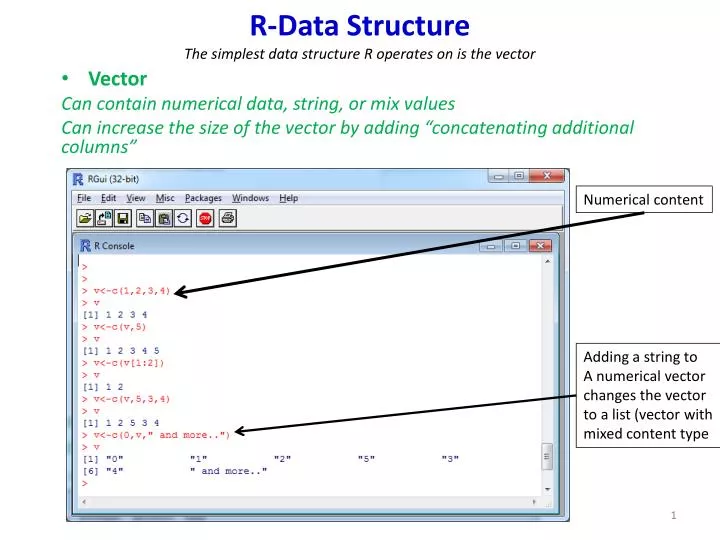
R-Data Structure The simplest data structure R operates on is the vector. Vector Can contain numerical data, string, or mix values Can increase the size of the vector by adding “concatenating additional columns”. Numerical content. Adding a string to A numerical vector changes the vector

E N D
R-Data StructureThe simplest data structure R operates on is the vector • Vector Can contain numerical data, string, or mix values Can increase the size of the vector by adding “concatenating additional columns” Numerical content Adding a string to A numerical vector changes the vector to a list (vector with mixed content type
Operation on numerical vector Normal operataion: -,+,* 1/x (reciprocal),mean, etc. For example: • v<-c(1,2,3,4) • inv <- 1/v #will assign to inv the reciprocal of each value of v Example: y <- c(v, 0, v) z<-mean(y)
Sequences (special vectors of numeric values) 1:nmeans 1,2,..n Example1 V<-c(1:3) means v<-c(1,2,3) Example2: n<-1:30 Example3: n<-2*1:15 “:” has higher priority Example4:n<-seq(-5:5) Exercise Try seq(-5,5) and compare with seq(-5:5) Use help(seq) to learn more about the seqinstruction
R-Data Structure • Matrix matrix(data, nrow, ncol, byrow) The datais a list of the elements that will fill the matrix The nrow and ncol arguments specify the dimension of the matrix. Often only one dimension argument is needed. For example, if there are 20 elements in the data list and ncol is specified to be 4 then R will automatically determine that there should be 5 rows and 4 columns since 4*5=20. byrow takes value in {TRUE,FALSE} The byrow argument specifies how the matrix is to be filled. The default value for byrow is FALSE which means that by default the matrix will be filled column by column.
[,1] means “all the rows of column 1” [1,] means “all the columns of row 1”
R-Data Structure • Data Frame A data frame is used for storing data tables. It is a list of vectors of equal length. For example, the following variable df is a data frame containing three vectors v1, v2, v3. v1 = c(2, 3, 5) v2 = c("aa", "bb", "cc") v3 = c(TRUE, FALSE, TRUE) df = data.frame(v1,v2,v3) # df is a data frame df
R-Data Structure List: A list is a vector in which the various elements need not be of the same type Example V<-c(1,”2”,”hello”,TRUE) Factor: A factor is a vector of categorical data. Storing data as factors insures that the modeling functions will treat such data correctly. Example: > data = c(1,2,2,3,1,2,3,3,1,2,3,3,1) > fdata = factor(data) > fdata [1] 1 2 2 3 1 2 3 3 1 2 3 3 1 Levels: 1 2 3 The output shows the content of fdata but also The distinct values of the categorical attribute
Importing Data • read.table(path, more parameters…) mydata<- read.table("c:/mydata.csv", header=TRUE, sep=",", row.names="id") Path to the file note the “/” instead of “\” on Ms windows systems Delimiter Used in the file TRUE=Include the header row Optional Row names Use help(read.table) for more info Also consider read.csv() instruction to import commas delimited For example: read.csv("http://www2.cs.uh.edu/~zechun_cao/TA_Resources/iris.data")
Original file Output
Importing Data Excel File read.xls Exercise: The best way to import data in Excel format is to save the data as .csv and then use read.table() to import it. However, the read.xls is often used. Since it is not part of the core R library, it has to be installed and loaded into the workspace. Use read.xls to read an excel file into R. (read.xls is part of the gdata package
Answer >install.packages(pkgs="gdata") >library(gdata) >data <- read.xls(path)
Operations on Dataset/sub-setting x1,x2,x3,class 0,2,2,A 0,3,2.5,B 0,3,3,A 1,3,3,B 1,3.5,4,c 1,3,2,A 1,4,2,c 1,4,3,A 0,1,3,B 0,1,4,A 1,2,2,c 1,2.5,1,A • Select columns (variables) • Drop columns (variables) • Select Observations (rows) • Random Sampling (exercise) dataset
Operations on Dataset/sub-setting Sub-setting by selecting columns Example1: # select variables x1, x3myvars <- c(“x1", “x3“)mysubSet<- dataset [myvars]mysubSet Example2: # select jth variable and kththru mthvariablesnewdata<- dataset[c(j,k:m)]
Operations on Dataset/sub-setting Drop some columns # exclude 1st and 3rd variable mysubSet <- dataset[c(-1,-3)] Also to delete a column assign NULL to the column Example:# delete variables x1mydata$x1<- NULL
Operations on Dataset/sub-setting Get row 1 to n, for all columns Select Observations # first n observationsmysubSet<- dataset[1:n,]# based on variable valuesmysubSet<- dataset[ which(dataset$x3==2 & dataset$x2 > 2), ] Or equivalently # based on variable values attach(dataset)mysubSet <- dataset[ which(x3==2 & x2 > 2), ]detach(dataset)
Operations on Dataset/sub-setting Sampling dataset = read.csv("C:/Users/paul/Desktop/R_wd/Lab/example.csv") dataset dataset[sample(nrow(dataset), 3), ] Using the dataset in the next box write a script that selects 4 rows randomly. Step 1: import the file. Step2: use srsdf to sample x1,x2,x3,class 0,2,2,A 1,3,2.5,B 1.5,3.8,3,A 2,4,3,B 2.1,3.5,4,c 2.3,3.8,2,A 2.8,4,2,c 3,4,3,A 3.2,4.5,3,B 3.4,4.6,4,A 3.6,4.8,2,c 3.6,5,1,A
Answer dataset = read.csv("C:/Users/paul/Desktop/R_wd/Lab/example.csv") dataset dataset[sample(nrow(dataset), 3), ]
Operations on Dataset Split data frame or matrix split() #divide into groups by vector/factor Example >dataset = read.csv("C:/Users/paul/Desktop/R_wd/input/Data_TPRTI/weka/EXAMPLE.csv") >classes<-split(dataset,dataset$class) >classes Observe that split() has grouped the row of same class together because the group column was specified to be the class column
Operations on Dataset/sub-setting • subset() #subset data with logical statement The subset( ) function is the easiest way to select variables and observations. In the following example, we select all rows that have a value of x3==2 and x2>2. We keep the x1, x2, and class columns. mysubSet<- subset(dataset, x3==2 & x2 >2, select=c(x1, x2,class))
Operations on Dataset/sub-setting Use help() to learn about • Merge data frames merge() #merges two data frames d1, and d2 into one data frame • Combine a row or column to a data frame cbind() :Add a new column to a data frame rbind() : a new row to a data frame
Practice exercise Exercise 1-Download the dataset Iris from www.cs.uh.edu/~zechun_cao/DM12F.html and import the data Into your R session 2-Find out how many classes are in the file. The output column is the last column 3-Multiply the 3rd column by 2 and combine this new column to the data frame.
Complete the exercise Thank you!