Download
1 / 24
240 likes | 346 Views
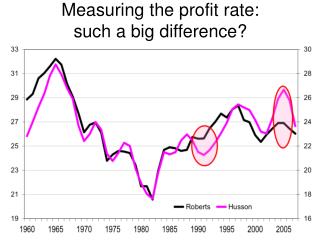
Analyzing the rate of profit across the USA, Europe, and Japan, weighted by GDP, and its impact on productivity and accumulation. Explore strategies to prevent profit rate decline and maintain profitability amid changing accumulation rates.

E N D
Two stylized facts2. profit and accumulation USA + Europe + Japan. Weighted by GDP
Two stylized facts1. profit and productivity USA + Europe + Japan. Weighted by GDP
How to avoid a fall in the rate of profit Red curve: the profit rate decreases when the accumulation rate is rising With a rate of “full” accumulation I/K°, the profit rate is R° (point B) With a lower rate of accumulation (I/K) the actual profit rate (R) is higher (point A) By decreasing the rate of accumulation, it is therefore possible to maintain the profit rate at a higher level (see arrows 1) The consequence is a gap between the profit rate and the rate of accumulation (see arrow 2)
Le capitalisme néolibéral ne pouvait monter jusqu’au ciel