Download
1 / 25
250 likes | 342 Views
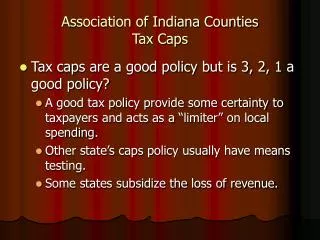
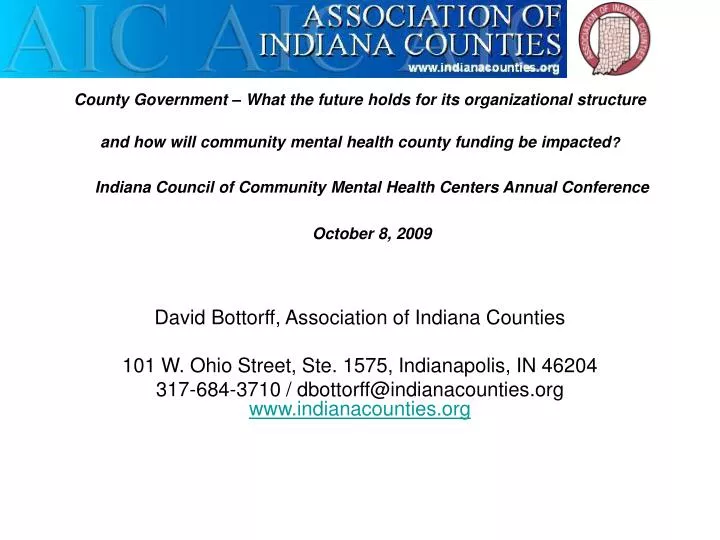
County Government – What the future holds for its organizational structure and how will community mental health county funding be impacted ?. Indiana Council of Community Mental Health Centers Annual Conference October 8, 2009. David Bottorff, Association of Indiana Counties

E N D
County Government – What the future holds for its organizational structure and how will community mental health county funding be impacted? Indiana Council of Community Mental Health Centers Annual ConferenceOctober 8, 2009 David Bottorff, Association of Indiana Counties 101 W. Ohio Street, Ste. 1575, Indianapolis, IN 46204 317-684-3710 / dbottorff@indianacounties.org www.indianacounties.org
County Government Structure and Changes to Funding Local Government Services
Who is Elected in County Government Auditor Coroner Assessor Recorder Clerk of the Circuit Court Surveyor Council Treasurer Commissioners Sheriff Judges Prosecutor
Who is Elected Three Commissioners (Executive and Legislative Powers) Three districts but a county wide vote Four Year Term Staggered Election Cycle Seven Person County Council (Fiscal Powers) Four Districts (District Only vote) Three At-Large (County wide vote) Four Year Term Staggered Election Cycle (Different for Lake, St Joseph and Marion)
Current County Government Structure ↑ Designed to limit the authority of elected officials ↑ Designed to give voters authority over offices ↑ Designed with term limits ↑ Designed to include part time participation in county government ↑ Designed with a multitude of checks and balances
Current County Government Structure Checks and Balances Checks and Balances between local offices Commissioners, Councils, Independently Elected Offices Checks and Balances between locals offices and state offices State Auditor, DLGF, Secretary of State, Courts, IDEM,
“Reform” Proposals Three Commissioners (Executive and Legislative Powers) Become 1 Executive (Elected or Appointed) Transfer Legislative Powers to Council Decreases pool of people who can run for the office Seven Person County Council (Fiscal Powers) Become Fiscal and Legislative Body Decreases pool of people who can runfor the office
“Reform” Proposals These offices become appointed Auditor Coroner Assessor Recorder Clerk of the Circuit Court Surveyor Treasurer Sheriff Judges
“Reform” Proposals Consolidates Power Diminishes Voter Input Diminishes Leadership Development More non elected people have more power over citizens Removes Checks and Balances Diminish Rural Representation
Local Government Changes Townships no longer do roads or schools County Council created to be a check on commissioners and finances of other offices Voluntary changes occurring New fiscal constraints will force changes
Fiscal Constraints - Poor Economy Change in AVGQ (Tied to income not AV) Levy Multiplier - Property Tax Caps
Poor Economy State Individual Income Tax Collection in Million Month 2008 2009 %Difference January $ 562.7 $ 466.1 - 17.2% February $ 150.8 $ 139.0 - 7.9% March $ 342.8 $ 270.5 - 21.1% April $ 858.0 $ 595.6 - 31.0% Total YTD $ 1,914.3 $ 1,471.2 - 23.0% Source Indiana State Budget Agency FY 2009 MONTHLY REVENUE YEAR OVER-YEAR COMPARISONS March 2009 and Revenue Report April 2009
Poor Economy AVGQ Levy Multiplier • Six year rolling average of non-farm personal income • Nonfarm personal income -Income that is received by all persons from all sources, including salaries and wages, supplements, adjusted proprietors' income, adjusted rental income, dividends, interest, and transfer receipts minus farm income, which is comprised of the net income of sole proprietors, partners and hired laborers arising directly from the current production of agricultural commodities, either livestock or crops. • In Indiana, nonfarm personal income makes up over 99% of personal income • AVGQ Levy Multiplier for 2010 3.8%
Property Tax Caps Sounds Good to taxpayers Tax Savings to some taxpayers Revenue Loss for Locals Replacement Revenue Creates Tax Liability Shift
Property Tax Caps What is the property tax cap (aka: circuit breaker)? Property tax cap based upon gross assessed value A taxpayer’s NET tax liability cannot exceed a certain percent of the GROSS assessed value of the property Capped percentage depends upon the property’s classification – homestead, residential, real and personal (commercial & industrial) properties
Property Tax Caps 2009 1.5% Homesteads 2.5% Other Residential 3.5% Commercial/Industrial Rental Property was the biggest beneficiary of tax caps in 2009 - 82% of the total credits went to rental owners. - 12% of the credits went to commercial, industrial and utility properties 3% of the total credits went to homesteads (Source LSA in 68 counties for which data is available)
Why Homesteads do not benefit from the caps as much as other properties? • Supplemental Homeowner & Senior Deductions: • Increases the Standard Deduction for Homesteads from the lesser of $45,000 or 50% of AV to the lesser of $45,000 or 60% of AV • A new Supplemental Deduction equal to 35% of the next $600,000 of AV remaining after the application of Standard Deduction and 25% of remaining AV over $600,000 • Provides that property tax bills for seniors with individual incomes of less than $30,000 or joint incomes of less than $40,000 and AV that does not exceed $160,000 cannot increase from 2007 levels by more than 2% per year.
Homesteads • - Homesteads made up 42% of taxable assessed value in 2008. • - This combined with other factors reduced taxable AV by 13% in 2009 • - Causes a tax rate increase • (Source LSA in 68 counties for which data is available)
Property Tax Caps - Constitutional Property Tax Caps still not “permanent” - Definitions of Property terms can be changed - AV - Homestead - Agriculture - Apartment - Excess Residential
2009 Losses by Units Total $ 31.331 Million - Counties $5.297 Million (17%) - Townships $490,000 (1.6%) - Cities/Towns $13.377 Million (43%) - Schools $9.989 Million (32%) - Library $1.328 Million (4%) - Special Districts $847,000 (2.7%) (Source LSA in 68 counties for which data is available)
Replacement Options • LOIT options • A. Replacement of allowable levy growth (1% maximum) • B. Property tax relief (1% maximum) in the form of local ptrc, homestead credits or general property tax replacement relief for all taxpayers • C. Public safety expenditures (up to .25%) • Permitted only if LOIT is also adopted for either option A or B • Permitted if A or B are adopted at a minimum of .25% combined
County Government – What the future holds for its organizational structure and how will community mental health county funding be impacted? Indiana Council of Community Mental Health Centers Annual ConferenceOctober 8, 2009 David Bottorff, Association of Indiana Counties 101 W. Ohio Street, Ste. 1575, Indianapolis, IN 46204 317-684-3710 / dbottorff@indianacounties.org www.indianacounties.org