Download
1 / 15
150 likes | 158 Views
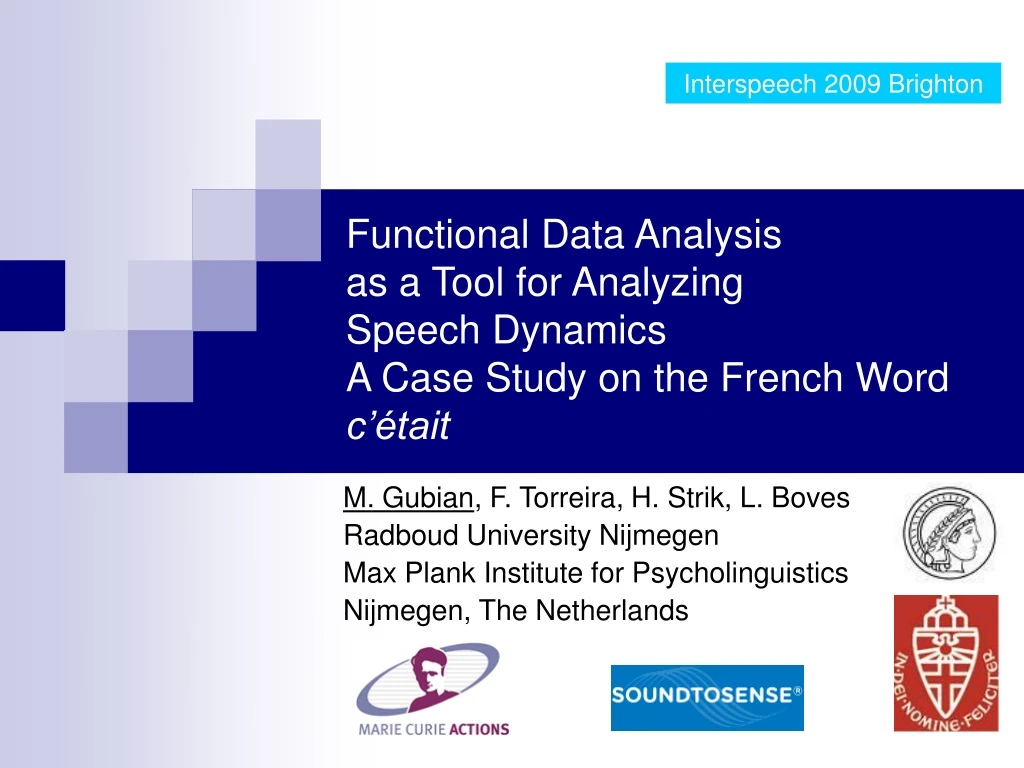
Interspeech 2009 Brighton. Functional Data Analysis as a Tool for Analyzing Speech Dynamics A Case Study on the French Word c’était. M. Gubian , F. Torreira, H. Strik, L. Boves Radboud University Nijmegen Max Plank Institute for Psycholinguistics Nijmegen, The Netherlands. Outline.

E N D
Interspeech 2009 Brighton Functional Data Analysisas a Tool for AnalyzingSpeech DynamicsA Case Study on the French Word c’était M. Gubian, F. Torreira, H. Strik, L. Boves Radboud University Nijmegen Max Plank Institute for Psycholinguistics Nijmegen, The Netherlands
Outline • Introduction to Functional Data Analysis (FDA) • in general • extending Principal Component Analysis (PCA) • Case study • speech reduction of the French word c’était • what FDA could show • Conclusions • References
Introduction to Functional Data Analysis (FDA)
Example x x x salary salary x x x x x age age Functional Data Analysis: an extension of (some) statistical techniques to the domain of functions CLASSIC FDA • Ask people: • How old are you? • How much do you earn? • Each data point is a point in 2D • Record people salary through the years • Each “data point” is a whole CURVE
PC1 x PC2 x x x x x x x x x x x x x x x x x x salary x x x x x x x x x x x x x x x x x 25 65 age ClassicPrincipal Component Analysis (PCA)
salary 25 65 age Functional Data Analysis • Join original samples with interpolating functions (e.g. B-splines) • Possibly align corresponding events (e.g. graduation dates) • This functional representation allows to reuse known statistical tools like PCA and linear regression
PC 1 Prob. density + mean - salary salary PC scores 0 PC 2 Prob. density 25 25 65 65 age age + mean - PC scores 0 Functional PCA
C’était (“it was”) • In casual speech is pronounced [setε] or [stε] • Question: in the [stε] case, are there traces of the lexical /e/? • If yes, [st] in [stε] is different from [st] in stage, station, … • the underlying reduction process is gradual • if no, the process is categorical • Method: acoustic energy in [0-3KHz] was measured through time in [st] tokens from [stε] and from words like stage • The dynamics between [s] and [t] could reveal correlates of mouth opening gesture • Functional PCA was applied
Results • 80 [st] from lexical /st/ + 183 [st] from [stε] in c’était
Results (cont.) • 80 [st] from lexical /st/ + 183 [st] from [stε] in c’était • + 186 [set] from [setε] in c’était
Conclusions • Functional Data Analysis allows to do statistics on data that is naturally represented by curves or trajectories • It provides both VISUAL and QUANTITATIVE results • All the information contained in the curve dynamics is used • No need to reduce a curve to a set of significant features (e.g. peaks, slopes) • Speech research can benefit from FDA in areas where curves are analyzed • Pitch contours • Formants
References • Functional Data Analysis website: www.functionaldata.org • Books: • Software: a bilingual (R and MATLAB) tool is freely available online
Functional linear models y(t) = a(t) + b(t) x diphthong, x = 0 hiatus, x = 1 Confidence intervals for a(t) and b(t) R2(t) = percentage of explained variance