Download

1 / 48
490 likes | 518 Views
Discover how cellular automata models are used in Ecology to study complex ecological systems, including rule sets, neighborhood configurations, and plant population dynamics. Consider models like totalistic rules and plant growth simulations.

E N D
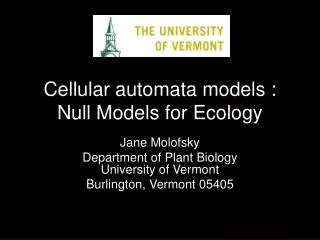
Cellular automata models :Null Models for Ecology Jane Molofsky Department of Plant BiologyUniversity of Vermont Burlington, Vermont 05405
Cellular automata models and Ecology • Ecological systems are inherently complex. • Ecologists have used this complexity to argue that models must also be correspondingly complex
Cellular automata models in Ecology • Search of ISI web of science ~ 64 papers • Two main types • Empirically derived rules of specific systems • Abstract models • Many more empirical models of specific systems than abstract models
1-dimensional totalistic rule of population dynamics • Individuals interact primarily locally • Each site is occupied by only one individual • Rules to describe transition from either occupied or empty • 16 possible totalistic rules to consider Molofsky 1994 Ecology
Ecological Scenarios • Two types of competition • Scramble • Contest • Two scales of dispersal • Local • Long
1 0 1 0 1 0 0 1 1 0 0 0 1 0 1 0 1 0 0 0 1 Possible neighborhood configurations 1 1 1 Sum 0 1 2 3
Transition Rules Sum 0 1 2 3 Local Dispersal 0 1 1 0 Long distance Dispersal 1 1 1 0
Totalistic Rule Set 2 states, nearest neighbors 28 or 256 possible rules Scramble Contest
Totalistic Rule Set • How often we expect complex dynamics to occur? • Ignore the 2 trivial cases • 6/14 result in “chaos”, 6/14 periodic, 2/14 fixation • How robust are dynamics to changes in rule structure?
Totalistic Rule Set 2 states, nearest neighbors 28 or 256 possible rules Scramble Contest
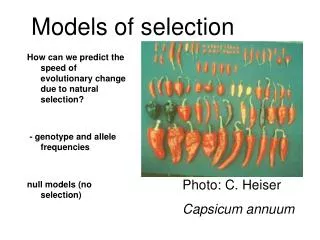
Do plant populations follow simple rules? 1-dimensional experimental design Grown at 2 different spacings (densities) Cardamine pensylvanica Fast generation time No seed dormancy Self-fertile Explosively dispersed seeds Molofsky 1999. Oikos
Do plant populations follow simple rules? • In general, only first and second neighbors influenced plant growth. • However, at high density, long range interactions influenced final growth
Experimental Plant Populations Replicated 1-dimensional plant populations Followed for 8 generations Fast generation time No seed dormancy Self-fertile Explosively dispersed seeds
Two dimensional totalistic rule • Two species 0, 1 • von Neumann neighborhood • Dynamics develop based on neighborhood sum • 64 possible rules • Rules reduced to 16 by assuming that when only 1 species is present ( i.e sum of 0 or 5), it maintains the site the next generation • 16 reduced to 4 by assuming symmetry
Biological Scenarios Positive Frequency Dependence Negative Frequency Dependence Allee effect
System Behavior 00 01 1,1 P1= probability that the target cell becomes a 1 given that the neighborhood sum equals 1 1,0 periodic Ergodic (0.2,0.4)”Voter rule” P2 clustering Phase separation P2= probability that the target cell becomes a 1 given that the neighborhood sum equals 2 0,0 0,1 P1 00 10 Molofsky et al 1999. Theoretical Pop. Biology
0.98,0.98 0.27,0 0.31,0 0.35, 0 D. Griffeath, Lagniappe U. Wisc. Pea Soup web site
Frequency dependenceDispersal Probability that a migrant of species 1 arrives on the site Probability that the migrant establishes: H1=0.5 + a (F1-0.5) Neighborhood shape Probability that a site is colonized by species 1 Moore neighborhoood
Positive frequency dependence Molofsky et al 2001. Proceedings of the Royal Society
Spatial Model One individual per grid cell Determine the probability that a species colonizes a cell Update all cells synchronously Stochastic Cellular Automata
Transition Rule Frequency dependence Dispersal Probability that a migrant of species 1 arrives on the site Probability that a site is colonized by species 1 Probability that the migrant establishes h1=0.5 + a (f1-0.5) P1 = h1f1/(h1f1 + h2f2+ h3f3+ h4f4+ h5f5+ h6f6+ h7f7+ h8f8+ h9f9+ h10f10 )
The neutral case • (a=0) Ecological Drift sensu Hubbell 2001
2. Positive Frequency (a=1) Generation 0 Generation 100,000 Molofsky et al 2001. Proc. Roy. Soc. B.268:273-277.
3. Positive Frequency 20 % unsuitable habitat Generation 0 Generation 100,000
Generation 0 Generation 100,000 4. Positive Frequency Dependence 40% unsuitable habitat
Interaction of the strength of frequency dependence and the unsuitable habitat Number of species after 100 000 generations Molofsky and Bever 2002. Proceedings of the Royal Society of London
Invasive species Local interactions: Yes, reproduces clonally Exhibits positive frequency dependence: Yes High levels of diversity: Yes No obvious explanation: Yes Lavergne, S. and J. Molofsky 2004. Critical Reviews in Plant Sciences
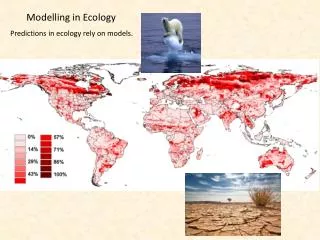
Consideration of spatial processes requires that we explicitly consider spatial scale Each process may occur at its own unique scale
Competition may occur over short distances but dispersal may occur over longer distances Grazing by animals in grasslands may occur over long distances while seed dispersal occurs over short distances
Negative frequency dependence Two species, two processes dispersal frequency dependence Probability that the migrant establishes: H1=0.5 + a (F1-0.5) Probability that a migrant of species 1 arrives on the site Probability that a site is colonized by species 1
D1 F1 Each process can occur at a unique scale Interaction neighborhood Dispersal neighborhood Focal site Molofsky et al 2002 Ecology
Local Frequency DependenceLocal Dispersal Weak Frequency Dependence a = - 0.01 Intermediate Frequency Dependence a= -0. 1 Strong Frequency Dependence a= -1
For local interactions when frequency dependence is strong (a = -1) random patterns develop because H1 = 1 - F1, D1 = F1 P1 = (1- F1 ) , F1 / (1- F1 ) , F1 + F1 (1- F1 ) = (1- F1 ) , F1 / 2( (1- F1 ) , F1 ) = 0.5
Weak Frequency Dependencea = -0.01 Dispersal and Frequency Dependence at same scale Local Dispersal Local Frequency Dependence Long Dispersal Long Frequency Dependence
Local Frequency Dependence Long Distance Dispersal Strong Frequency Dependence a = - 1 Weak Frequency Dependence a = - 0.01
Why bands are stable? Local, strong, frequency dependence (over the large dispersal scale, the two species have the same frequency: D1=D2) Because the focal, blue, cell is mostly surrounded by yellow, is stays blue
Local DispersalLong Distance Frequency Dependence Strong Frequency Dependence a = - 1 Weak Frequency Dependence a = - 0.01
Why bands are stable? Local dispersal (over the large interaction scale, the two species have the same frequency: H1=H2) Because the focal, blue, cell is mostly surrounded by yellow, is becomes yellow
How robust are these results? Boundary Conditions Torus, Reflective or Absorbing Interaction Neighborhoods Square or Circular Updating Synchronous or Asynchronous Disturbance Habitat Suitability
Effect of Disturbance Strong Frequency Dependence a = -1 Disturbance = 25 % of cells Local Frequency Dependence Long Distance Dispersal Local Dispersal Long Distance Frequency Dependence
Habitat Suitability Strong Frequency Dependence a = -1 25 % of cells are unsuitable Local Dispersal Long Distance Frequency Dependence Local Frequency Dependence Long Distance Dispersal
Processes that give rise to patterns… Strong Negative Frequency Dependence only if equal scales Weak Negative Frequency Dependence only if long distance dispersal Weak Negative Frequency Dependence only if dispersal is local Strong Negative Frequency Dependence only if unequal scales Weak Positive Frequency Dependence only if dispersal is local Strong Positive Frequency Dependence most likely if local scales only
Negative frequency dependence If dispersal and frequency dependence operate over different scales, strong patterning results Striped patterns may explain sharp boundaries between vegetation types Need to measure both the magnitude and scale of each process
Next step • Non symmetrical interactions • For non-symmetrical interactions, what is necessary for multiple species to coexist? Most multiple species interactions fail but we can search the computational universe and ask, which constellations are successful and why?