Download
1 / 22
230 likes | 403 Views
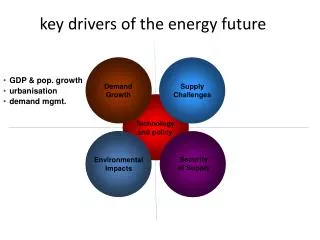
key drivers of the energy future. GDP & pop. growth urbanisation demand mgmt. Demand Growth. Supply Challenges. Technology and policy. Security of Supply. Environmental Impacts. energy use grows with economic development. energy demand and GDP per capita (1980-2004). US. Australia.

E N D
key drivers of the energy future • GDP & pop. growth • urbanisation • demand mgmt. Demand Growth Supply Challenges Technology and policy Security of Supply Environmental Impacts
energy use grows with economic development energy demand and GDP per capita (1980-2004) US Australia Russia France Japan Ireland S. Korea UK Malaysia Greece Mexico China Brazil India Source: UN and DOE EIA Russia data 1992-2004 only
demographic transformations Oceania Oceania N-America N-America Africa Africa S-America S-America Europe Europe 8.9 billion 6.3 billion source: United Nations Asia Asia
Global energy demand is projected to increase by just over one-half between now and 2030 – an average annual rate of 1.6%. Over 70% of this increased demand comes from developing countries Global Energy Demand Growth by Region (1971-2030) Energy Demand (Mtoe) Notes: 1. OECD refers to North America, W. Europe, Japan, Korea, Australia and NZ 2. Transition Economies refers to FSU and Eastern European nations 3. Developing Countries is all other nations including China, India etc. Source: IEA World Energy Outlook 2006
annual primary energy demand 1971-2003 Source IEA, 200 (Excludes biomass)
- industry - transport - other sectors - power growing energy demand is projected Global Energy Demand Growth by Sector (1971-2030) Energy Demand (bnboe) Key: Notes: 1. Power includes heat generated at power plants 2. Other sectors includes residential, agricultural and service Source: IEA WEO 2004
key drivers of the energy future • significant resources • non-conventionals • GDP & pop. growth • urbanisation • demand mgmt. Demand Growth Supply Challenges Technology and policy Security of Supply Environmental Constraints
US energy supply since 1850 Source: EIA
global primary energy sources Nuclear Oil Hydro Oil Coal Coal Gas Natural gas Hydro Nuclear
BAU (business as usual)projection of primary energy sources ’04 – ’30 Annual Growth Rate (%) 6.5 1.3 2.0 0.7 2.0 1.3 1.8 Total 1.6 Note: ‘Other renewables’ include geothermal, solar, wind, tide and wave energy for electricity generation Source: IEA World Energy Outlook 2006 (Reference Case)
substantial global fossil resources Yet to Find Unconventional Unconventional Reserves & Resources (bnboe) R/P Ratio 164 yrs. Proven Yet to Find Yet to Find R/P Ratio 67 yrs. R/P Ratio 41 yrs. Proven Proven Source: World Energy Assessment 2001, HIS, WoodMackenzie, BP Stat Review 2005, BP estimates
key drivers of the energy future • significant resources • non-conventionals • GDP & pop. growth • urbanisation • demand mgmt. Demand Growth Supply Challenges Technology and policy • dislocation of resources • import dependence Security of Supply Environmental Impacts
FSU Gas Europe North America Resource Potential (bnboe) Resource Potential (bnboe) Oil Gas Coal Middle East AsiaPacific Oil Gas Coal Resource Potential (bnboe) Africa Resource Potential (bnboe) South America Oil Oil Oil Oil Gas Gas Gas Gas Coal Coal Coal Coal Oil Gas Coal Key: - unconventional oil - conventional oil - coal - gas significant hydrocarbon resource potential Oil, Gas and Coal Resources by Region (bnboe) Resource Potential (bnboe) Resource Potential (bnboe) Resource Potential (bnboe) Source: BP Data
dislocation of fossil fuel supply & demand Source: BP Statistical Review 2006
key drivers of the energy future • significant resources • non-conventionals • GDP & pop. growth • urbanisation • demand mgmt. Demand Growth Supply Challenges Technology and policy • dislocation of resources • import dependence • local pollution • climate change Security of Supply Environmental Impacts
climate change and CO2 emissions • CO2 concentration is rising due to fossil fuel use • The global temperature is increasing • other indicators of climate change • There is a plausible causal connection • but ~1% effect in a complex, noisy system • scientific case is complicated by natural variability, ill-understood forcings • Impacts of higher CO2 are uncertain • ~ 2X pre-industrial is a widely discussed stabilization target (550 ppm) • Reached by 2050 under BAU • Precautionary action is warranted • What could the world do? • Will we do it?
crucial facts about CO2 science • The earth absorbs anthropogenic CO2 at a limited rate • Emissions would have to drop to about half of their current value by the end of this century to stabilize atmospheric concentration at 550 ppm • This in the face of a doubling of energy demand in the next 50 years (1.5% per year emissions growth) • The lifetime of CO2 in the atmosphere is ~ 1000 years • The atmosphere will accumulate emissions during the 21st Century • Near-term emissions growth can be offset by greater long-term reductions • Modest emissions reductions only delay the growth of concentration (20% emissions reduction buys 15 years)
Concentration Emissions some stabilization scenarios
greenhouse gas emissions in 2000 by source Source: Stern Review, from data drawn from World Resources Institute Climate Analysis Indicators Tool (CAIT) on-line database version 3.0
CTL GTL Heavy Oil Ultra Deep Water Enhanced Recovery CNG Arctic Key: - supply side options - demand side options two key energy considerations – security & climate Carbon Free H2 for Transport High Capture & Storage Conv. Biofuels Hybrids Adv. Biofuels Capture & Storage Vehicle Efficiency (e.g. light weighting) C&S Concern over Future Availability of Oil and Gas Dieselisation Low Low High Concern relating to Threat of Climate Change
corn ethanol is sub-optimal • Production does not scale to material impact • 20% of US corn production in 2006 (vs. 6% in 2000) was used to make ethanol displacing ~2.5% of petrol use • 17% of US corn production was exported in 2006 • The energy and environmental benefits are limited • To make 1 MJ of corn ethanol requires 0.9 MJ of other energy (0.4 MJ coal, 0.3 MJ gas, 0.04 MJ of nuclear/hydro, 0.05 MJ crude) • Net CO2 emission of corn ethanol ~18% less than petrol • Ethanol is not an optimal fuel molecule • Energy density, water, corrosive,… • There is tremendous scope to improve (energy, economics, emissions)
Key: - power generation options - supply option evaluating power options power sector High Solar Unconventional Gas Hydrogen Power Nuclear Wind Biomass Concern over Future Availability of Oil and Gas Coal Hydro Geothermal Gas CCGT Low Low Concern relating to Threat of Climate Change High