Download
1 / 9
90 likes | 98 Views
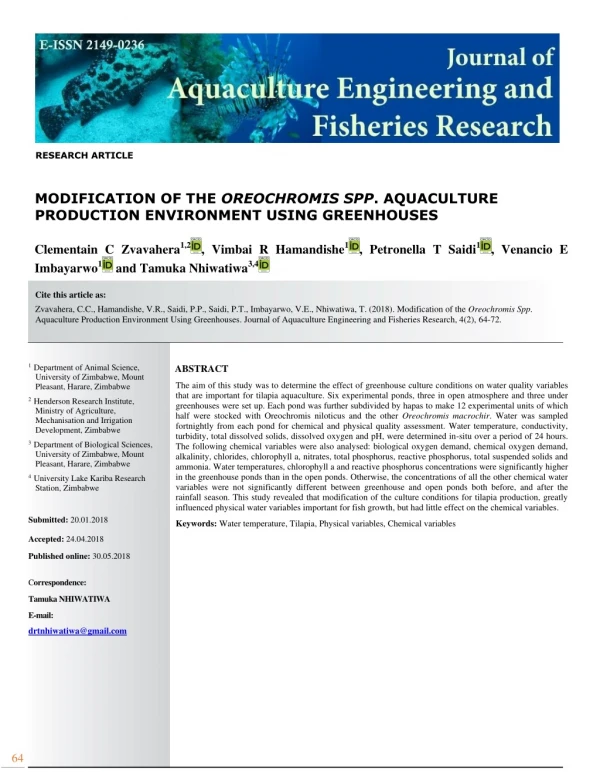
The aim of this study was to determine the effect of greenhouse culture conditions on water quality variables<br>that are important for tilapia aquaculture. Six experimental ponds, three in open atmosphere and three under<br>greenhouses were set up. Each pond was further subdivided by hapas to make 12 experimental units of which<br>half were stocked with Oreochromis niloticus and the other Oreochromis macrochir. Water was sampled<br>fortnightly from each pond for chemical and physical quality assessment. Water temperature, conductivity,<br>turbidity, total dissolved solids, dissolved oxygen and pH, were determined in-situ over a period of 24 hours.<br>The following chemical variables were also analysed: biological oxygen demand, chemical oxygen demand,<br>alkalinity, chlorides, chlorophyll a, nitrates, total phosphorus, reactive phosphorus, total suspended solids and<br>ammonia. Water temperatures, chlorophyll a and reactive phosphorus concentrations were significantly higher<br>in the greenhouse ponds than in the open ponds. Otherwise, the concentrations of all the other chemical water<br>variables were not significantly different between greenhouse and open ponds both before, and after the<br>rainfall season. This study revealed that modification of the culture conditions for tilapia production, greatly<br>influenced physical water variables important for fish growth, but had little effect on the chemical variables.<br>

E N D
RESEARCH ARTICLE MODIFICATION OF THE OREOCHROMIS SPP. AQUACULTURE PRODUCTION ENVIRONMENT USING GREENHOUSES Clementain C Zvavahera1,2 , Vimbai R Hamandishe1 Imbayarwo1 and Tamuka Nhiwatiwa3,4 , Petronella T Saidi1 , Venancio E Cite this article as: Zvavahera, C.C., Hamandishe, V.R., Saidi, P.P., Saidi, P.T., Imbayarwo, V.E., Nhiwatiwa, T. (2018). Modification of the Oreochromis Spp. Aquaculture Production Environment Using Greenhouses. Journal of Aquaculture Engineering and Fisheries Research, 4(2), 64-72. 1 Department of Animal Science, University of Zimbabwe, Mount Pleasant, Harare, Zimbabwe ABSTRACT The aim of this study was to determine the effect of greenhouse culture conditions on water quality variables that are important for tilapia aquaculture. Six experimental ponds, three in open atmosphere and three under greenhouses were set up. Each pond was further subdivided by hapas to make 12 experimental units of which half were stocked with Oreochromis niloticus and the other Oreochromis macrochir. Water was sampled fortnightly from each pond for chemical and physical quality assessment. Water temperature, conductivity, turbidity, total dissolved solids, dissolved oxygen and pH, were determined in-situ over a period of 24 hours. The following chemical variables were also analysed: biological oxygen demand, chemical oxygen demand, alkalinity, chlorides, chlorophyll a, nitrates, total phosphorus, reactive phosphorus, total suspended solids and ammonia. Water temperatures, chlorophyll a and reactive phosphorus concentrations were significantly higher in the greenhouse ponds than in the open ponds. Otherwise, the concentrations of all the other chemical water variables were not significantly different between greenhouse and open ponds both before, and after the rainfall season. This study revealed that modification of the culture conditions for tilapia production, greatly influenced physical water variables important for fish growth, but had little effect on the chemical variables. 2 Henderson Research Institute, Ministry of Agriculture, Mechanisation and Irrigation Development, Zimbabwe 3 Department of Biological Sciences, University of Zimbabwe, Mount Pleasant, Harare, Zimbabwe 4 University Lake Kariba Research Station, Zimbabwe Submitted: 20.01.2018 Accepted: 24.04.2018 Keywords: Water temperature, Tilapia, Physical variables, Chemical variables Published online: 30.05.2018 Correspondence: Tamuka NHIWATIWA E-mail: drtnhiwatiwa@gmail.com 64
Journal of Aquaculture Engineering and Fisheries Research, 4(2), 64-72 (2018) Journal abbreviation: J Aquacult Eng Fish Res area for aquaculture. The district has two major dams and several perennial rivers that can ensure uninterrupted supply of water to aquaculture projects in the area. However, Mazowe District is characterized by mean annual temperature of 18.2°C while precipitation averages 901 mm (Meteorological Services Department, Harare, Zimbabwe). The area records relatively lower temperatures for the greater period of the year and is therefore not ideal for year-round production of tilapia. It becomes imperative to come up with strategies that will ensure aquaculture production across all areas regardless of climate. One such strategy is the adoption of climate control mechanisms such as erection of greenhouses for aquaculture production. The main objective of this study was to determine the effect of greenhouse culture conditions and the variability in the water quality variables important for aquaculture. Introduction Aquaculture pond management involves controlling pond water quality. The objective is to create an environment that is ideal for normal health and optimal production performance of the resident fish. Water quality in aquaculture ponds is defined in terms of its chemical and physical variables. These are dissolved oxygen, alkalinity, salinity, ammonia nitrogen, nitrites, nitrates, chlorides, pH, biological oxygen demand, chemical oxygen demand, conductivity and turbidity. The importance of each of these variables cannot be over-emphasized. They influence growth of various members of the ecosystem in the aquaculture pond. Collectively, the chemical and physical water variables affect growth of fish and plankton by influencing the rate of their metabolism, reproduction, life cycles and health of the fish (Mallya, 2007; Handeland et al., 2008). The levels and concentration of these water quality variables are greatly influenced by water temperature. Water temperature is critical for all physiological processes in fish, particularly spawning, development, growth, reproduction and metabolic processes (Kausar and Salim, 2006; Brander, 2007). Under natural conditions, fish production is restricted to the warmer months of the year when temperatures are favourable. In low temperature regions, the metabolic activity of fish is greatly reduced thereby negatively affecting their growth. In such climates, supplementary heat may need to be provided to raise the water temperature. This will ultimately increase the overall supply of fresh fish from aquaculture. The optimum temperature for growth and survival of fish varies with age and size. Juveniles of many species prefer warmer temperatures than adults. Tilapia fish, increasingly becoming the species of choice among aquaculture producers, are warm water species that have high growth rates and are highly adaptable to a wide range of environmental conditions. They can grow and breed in captivity as well as survive on poor quality feed. Tilapia fish species can reach market size of 500-600 grams in six to eight months under optimum temperature conditions of 30-35°C (Lucas and Southgate, 2003). It has been observed that tilapia fish species in Zimbabwe do not grow or breed in winter due to temperature below 22°C as compared to countries like Ethiopia where temperatures are above 25°C and breeding is throughout the year (Hirpo, 2013). Mazowe District in Zimbabwe, because of its proximity to the capital city, Harare, can be an important production Materials and Methods Description of the study area The study was carried out at the Fisheries Section of Henderson Research Institute (17°35’S and 30° 58’E) in Mazowe district of Zimbabwe. The Institute is in Agro- ecological region 2B in an area which is characterized by warm and temperate climate. The institute has a mean annual rainfall range and mean diurnal temperature of 750-850 mm and 18.2°C per year respectively, experiences very low temperatures for the greater period of the year (Zimbabwe Department of Meteorology Services Report, 2007-2012). The fisheries unit is supplied with water from the perennial Dasura River originating from the horticultural Mary Val Farm. The water is channelled by gravity to the fish ponds in the Fisheries Section though a 3 km long canal. Experimental design and sample collection Six ponds each measuring 8.5 m × 6 m and 1 m deep were used in a completely randomized design with two treatments, open ponds and greenhouse ponds, replicated three times. The dimensions of the greenhouses were 20 m × 10 m × 2 m constructed with 250 microns plastic sheath. Free circulation of air in the greenhouse was achieved by opening of the doors. Water samples were collected fortnightly from each pond using the improvised Ruttner sampler for chemical analysis whilst all physical variables were determined in-situ. Physical water variables Physical water variables, temperature, conductivity, DO, turbidity, total dissolved comprising of water 65
Journal of Aquaculture Engineering and Fisheries Research, 4(2), 64-72 (2018) Journal abbreviation: J Aquacult Eng Fish Res solids and pH, were determined in situ over a period of 24 hours at two hour intervals commencing at 0600 hours every day. Temperature and DO were measured with an oxygen-temperature meter (WTW Oxi 330), pH was measured using a pH meter (WTW pH 330) whilst conductivity and total dissolved solids were determined with a conductivity meter (WTW LF 330). Turbidity was measured according to the method of the measurement of turbidity with a spectrophotometer based on the fact that part of the incident light is reflected, while part is absorbed by the suspended particles and a portion of the light is transmitted through the solution. Chemical analysis Water samples were collected after every two weeks at 0600 hours immediately after the last physical water variable reading. These were collected over a period of six months: August, September, December and January. Samples were taken to the laboratory for estimation of biological oxygen demand (BOD), chemical oxygen demand (COD), alkalinity, chlorides, chlorophyll A, nitrates, total phosphorus, available phosphorus, total suspended solids, ammonia and sulphates. Suspended solids (mgl-1) and chlorophyll a concentration (µgl-1) were determined by filtering a known volume of water over calibrated Whatman GF/C 47 mm filters. The chlorophyll a concentration was measured using the ethanol extraction method described by Bronmark and Hansson (1998). Suspended solids were measured by drying the filtrate on the filters at 105°C for 24 hours and then measuring the difference in mass before and after filtration. Turbidity (FAU) was determined using a HACH DR2010 spectrophotometer. Analysis of chemical variables was done by means of a HACH DR/2010 portable data logging spectrophotometer and reagents. Total nitrogen and total phosphorus were determined using unfiltered water samples, while filtered samples were used in the determination of nitrates, ammonia and reactive phosphate. The detailed methods are manufacturer’s manual (HACH DR/2010 manual, 2000). Chlorides, sulphates and alkalinity were determined using standard laboratory methods (Bartram and Ballance, 1996), while Biological Oxygen Demand (BOD) was determined using the five-day incubation method (Bartram and Balance, 1996). Data analysis Data were analysed with the Statistical Analysis System (SAS) Version 9.3 (SAS, 2010). Water temperature above 30°C, favourable range for tilapia, were coded one and those below, unfavourable for tilapia, coded zero after which the chi-square test was carried out to determine if there was any association between treatment (greenhouse or open ponds) and the temperature scores. PROC TEST procedure was used to compare the means of the physical and chemical variables by time of day in greenhouse and open ponds for both chemical and physical variables. The effect of time of day and treatment on the concentrations and levels of the physical variables were evaluated with the PROC GLM procedure of SAS. The Least Significance Difference (LSD) method adjusted to the Kraemer-Tukey’s test was used to separate the means. The models for the respective physical and chemical variables were as follows: Water physical variables yijk=µ+ti+sj+(ts)ij+eijk Where yijk represented the physical water variables (conductivity, total dissolved solids and DO), µ was the overall mean due to conditions common to all observations, ti was the effect of the ith time of sampling, sj was the effect of the jth treatment (j=open pond, greenhouse pond), (ts)ij was the interaction effect of time of sampling and treatment and eijkl were the random residuals ~N (0, σe Chemical variables yij=µ+si+eij Where yij was the BOD, COD, ammonia, chlorides, nitrates, chlorophyll a, alkalinity, total phosphorus, reactive phosphorus, total nitrogen, si was the effect of the ith treatment (j=open pond, greenhouse pond) and eij were the random residuals ~N (0, σe Results Table 1 contains the summary statistics of the water October, November, 2). 2). summarized in the 66
Journal of Aquaculture Engineering and Fisheries Research, 4(2), 64-72 (2018) Journal abbreviation: J Aquacult Eng Fish Res Table 1. Summary statistics of the physical variables of greenhouse pond water (N=420) and open pond water (N=419). Variable Greenhouse ponds Open ponds Mean SD Mean SD Physical variables Water temperature (°C) Conductivity (s/ml) Total dissolved solids (mg/l) Dissolved oxygen (mg/l) pH Chemical variables Biological oxygen demand (mg/l) Chemical oxygen demand (mg/l) Turbidity Total suspended solids (mg/l) Alkalinity Chlorides (mg/l) Chlorophyll a (g/ml) Total nitrates (mg/l) Total phosphorus (mg/l) Reactive phosphorus (mg/l) Ammonia (mg/l) Sulphates 25.92 405.28 262.79 3.05 7.94 3.10 39.52 26.98 1.83 0.57 22.82 412.56 271.85 3.25 7.98 3.12 44.08 33.68 1.75 0.56 1.51 38.52 24.86 15.33 1.06 0.32 1.74 0.44 0.10 0.01 0.52 0.18 1.25 50.97 18.45 11.43 0.45 0.11 2.81 0.60 0.15 0.02 0.49 0.14 1.59 30.74 29.08 16.74 1.14 0.32 1.28 0.16 0.11 0.02 0.32 0.21 0.83 22.43 18.44 12.49 0.58 0.09 1.42 0.18 0.18 0.01 0.35 0.18 physical and chemical variables in greenhouse and open air ponds. The standard deviations for variables such as chemical oxygen demand, chlorophyll a and total phosphorus were relatively very high. This could be attributed to diurnal variations in the main water source, the river, which flowed through a vast area and in the process, carried minerals suspended solids and solutes with potential to modify composition in water. significantly higher (p<0.05) in the greenhouse ponds than in the open ponds for all the sampling months (Table 2). The mean difference between the two sites were lowest in December and highest in September. The range of temperature was relatively high for all the sampling months (Figure 1) with lowest water temperatures recorded at dawn around 0600 hrs and the highest around mid-day at 1200 hrs. Physical variables There was a significant association between water temperature and site (p<0.05; 2=24.58). Greenhouse ponds had water temperatures of at least 30°C on more occasions (44 days) than open ponds (9 days) whilst the latter had temperatures below 30°C on more occasions (410 times) than the former (376 times). High temperatures were achieved between 12 noon and 1300 hrs and was lowest at 0400 hrs of every day. Water temperatures were Monthly means of pH and all the physical variables for the sampling period are in Table 3. All physical variables were significantly influenced by treatment (p<0.05) during all the sampling months except dissolved oxygen (p>0.05). Time of sampling had no significant influence on all the physical water variables for all the sampling months except dissolved oxygen (p>0.05) in September, October, December and January. Before the onset of rains (September and October), conductivity was 67
Journal of Aquaculture Engineering and Fisheries Research, 4(2), 64-72 (2018) Journal abbreviation: J Aquacult Eng Fish Res Table 2. Mean water temperature for the sampling months for greenhouse and open ponds. Month Site N Mean water temperature (°C) s.e t-value of the difference 11.51* September Greenhouse ponds Open ponds Greenhouse ponds Open ponds Greenhouse ponds Open ponds Greenhouse ponds Open ponds Greenhouse ponds Open ponds 156 156 78 78 78 78 39 39 78 78 24.64 20.67 26.88 23.06 25.64 22.91 24.60 24.34 28.74 26.29 0.257 0.230 0.310 0.286 0.192 0.227 0.185 0.196 0.349 0.300 9.07* October 9.18* November 1.05* December 5.32* January Figure 1. Trends in diurnal water temperature (°C) from September 2015 to January 2016 for the greenhouse ponds (▲) and the open ponds (•). Table 3. Monthly mean of pH and all the physical variables, their standard errors and t-values of their means. Month Variable Greenhouse ponds Open ponds Mean s.e 8.46 0.042 393.38 3.236 256.91 2.788 2.63 0.133 8.02 0.038 381.58 5.360 t-value of the mean -1.45 -5.25* -4.68* -0.64 Mean 8.54 417.54 276.35 2.742 7.921 433.58 s.e Septembe r pH Conductivity (s/ml) Total dissolved solids (mg/l) Dissolved oxygen (mg/l) pH Conductivity (s/ml) Total dissolved solids (mg/l) Dissolved oxygen (mg/l) pH 0.036 3.270 3.079 0.123 0.031 5.358 October 1.94 -6.86* 247.45 4.48 7.66 0.915 0.442 0.013 292.76 4.42 7.78 4.404 0.449 0.022 -10.07* 0.09 -4.47* Novembe 68
Journal of Aquaculture Engineering and Fisheries Research, 4(2), 64-72 (2018) Journal abbreviation: J Aquacult Eng Fish Res r Conductivity (s/ml) Total dissolved solids (mg/l) Dissolved oxygen (mg/l) pH Conductivity (s/ml) Total dissolved solids (mg/l) Dissolved oxygen (mg/l) pH Conductivity (s/ml) Total dissolved solids (mg/l) Dissolved oxygen (mg/l) 413.72 263.39 4.39 7.42 422.92 285.33 2.84 7.37 440.27 280.04 3.31 1.629 1.247 390.68 248.89 4.36 7.39 407.28 272.95 3.15 7.44 406.78 267.53 3.96 3.733 3.364 5.66* 4.04* Decembe r 0.023 1.796 1.043 0.468 0.032 5.207 3.675 0.575 0.020 5.253 2.424 0.430 0.029 5.635 2.841 0.479 1.13 2.82* 4.64* 0.03 -1.64 4.36* 2.69* -0.87 January *Significantly different at P<0.05 Table 4. Means of the chemical water variables before and after commencement of the rain season. Period Variable Greenhouse ponds Mean 0.38 0.06 0.02 1.13 21.65 13.49 0.28 0.18 0.18 35.00 1.59 0.23 0.56 0.17 0.04 0.95 29.82 18.18 0.40 1.06 0.18 23.18 1.37 3.41 Open ponds t-value s.e Mean 0.15 0.04 0.01 1.23 27.83 15.59 0.29 0.20 0.23 29.59 1.68 1.08 0.18 0.23 0.02 0.99 31.20 18.70 037 0.54 0.16 32.700 1.43 1.64 s.e August to October Total nitrates (mg/l) Total phosphorus (mg/l) Reactive phosphorus (mg/l) Alkalinity (mg/l) Turbidity (NTU) Total suspended solids (mg/l) Chlorides (mg/l) Ammonia (mg/l) Sulphates (mg/l) Chemical oxygen demand (mg/l) Biological oxygen demand (mg/l) Chlorophyll a (g/ml) Total nitrates (mg/l) Total phosphorus (mg/l) Reactive phosphorus (mg/l) Alkalinity (mg/l) Turbidity (NTU) Total suspended solids (mg/l) (mg/l) Ammonia (mg/l) Sulphates (mg/l) Chemical oxygen demand (mg/l) Biological oxygen demand (mg/l) Chlorophyll a (g/ml) 0.128 0.017 0.004 0.111 4.560 2.931 0.020 0.027 0.042 6.55 0.351 0.135 0.207 0.064 0.007 0.120 5.300 3.080 0.033 0.106 0.019 7.429 0.234 0.657 0.047 0.005 0.002 0.121 4.280 2.734 0.018 0.051 0.049 5.723 0.218 0.304 0.048 0.085 0.004 0.214 6.490 4.667 0.030 0.137 0.024 6.755 0.210 0.515 1.70 0.91 1.28 -0.57 -0.99 -0.52 -0.21 -0.29 -0.77 0.62 -0.22 -2.54* 1.80 -0.52 2.39* -0.18 -0.16 -0.09 0.67 3.02* 0.90 -0.95 -0.17 2.13* November to January *Significant at P<0.05 69
Journal of Aquaculture Engineering and Fisheries Research, 4(2), 64-72 (2018) Journal abbreviation: J Aquacult Eng Fish Res significantly lower in water from greenhouse ponds (p<0.05) than open ponds. However, the beginning of the rain season in November coincided with significantly lower conductivity (p<0.05) in water in open ponds than in greenhouse ponds. Total dissolved solids followed a trend similar to conductivity over the sampling months. The mean difference in pH of greenhouse and open ponds water was not significantly different (p>0.05) for all the months except November during which significantly higher pH was recorded in water from open ponds. This could be attributed to the onset of rains which is usually mid- November in the study area. variables greenhouse and open ponds both before and after the rainfall season (p>0.05). showed no significant differences in Discussion The most important variable in aquaculture environment for production of tilapia fish is water temperature. It is a key determinant of all physiological processes occurring in the fish body since it directly influences growth by regulating vital body activities such as feeding, rate of metabolism, transformation and breeding. Indirectly, water temperature influences the rate of reactions and processes occurring between chemicals dissolved and suspended in the water body as well as other organisms which, together with the fish constitutes the water ecosystem. Results from this study indicated a significant increase in water temperatures of 16.57%, 11.92%, 1.07% and 9.32% in October, November, December and January respectively when ponds were covered by greenhouses. The magnitude of increase was, however; significantly lower in December (1.07°C) probably because of the atmospheric conditions during the rainy season. The atmosphere is usually overcast during this time of the year resulting in more or less similar conditions in the greenhouse and in the open ponds. Increases of 3-9°C in water temperatures through use of greenhouses to cover ponds were also reported by Musal et al., (2014) working on Oreochromic niloticus broodstock. Chemical variables The means of all chemical water variables in greenhouse and open ponds before and after the commencement of the rain season are in Table 4. Prior to commencement of the rains in November, the concentrations and levels of all chemical variables were not influenced by treatment (p>0.05) except chlorophyll a concentration (p=0.016; R2=0.159). Similarly, on commencement of the rain season, concentrations and levels of all chemical variables were not affected by treatment (p>0.05) except reactive phosphorus (p=0.027; R2 = 0.230) ammonia (p=0.007; R2=0.320) and chlorophyll a (p=0.047; R2=0.200) concentration. The relatively low values of R2 implied that the concentrations of the chemical variables were influenced not by treatment alone but other factors not captured in the study. Water from the greenhouse ponds had significantly elevated levels of chlorophyll a than the open pond water (p<0.05). Reactive phosphorus concentrations were higher in greenhouse than in open ponds (p<0.05). Otherwise the concentrations and levels of all the other chemical water fry and juveniles. The lowest water temperatures in greenhouse ponds were significantly higher than the reported lower lethal limits of 11-12°C for tilapia (Mustapha et al., 2012). The diurnal variation of water temperature in greenhouse ponds was almost similar to temperature variations in open ponds especially during the months of September - November. This was expected since there was no thermoregulation in the greenhouse ponds as the internal temperature were naturally regulated though atmospheric conditions. The ability of greenhouses to maintain relatively higher water temperatures throughout the day and at night reinforces the potential for greenhouse in improving culture conditions for fish survival, growth and reproduction. The actual water temperatures in greenhouse ponds in this study ranged, on average, from 24.60°C to 28.74°C. These water temperatures recommended temperature range of 27 to 32°C for tilapia were close to the There was no significant differences in pH between greenhouse and open ponds for all the months except in November during which pH was significantly higher in the latter than the former. This was probably due to the influence of the commencement of the rain season which resulted in an increase. The pH influences the aqueous equilibrium and toxicity of other water quality variables such as ammonia, and dissolved metals. For example, a high pH increases the toxicity of ammonia to fish whilst low pH increases toxicity of aluminium and copper. The pH of freshwater ponds can fluctuate considerably both daily and seasonally. The magnitude of this fluctuation will depend on the buffering capacity of the freshwater 70
Journal of Aquaculture Engineering and Fisheries Research, 4(2), 64-72 (2018) Journal abbreviation: J Aquacult Eng Fish Res system. Increasing the total alkalinity concentration in water helps buffer against pH changes. Concentrations of alkalinity below 20 mg/L often lead to large swings in daily pH values, which stress aquatic animals’ water quality (Lucas and Southgate, 2003). Generally, a pH range of 7.0 to 8.5 is ideal for biological productivity of fish. Fish can become stressed if water pH falls to between 4.0 and 6.5 on the lower end or 9.0 and 11.0 on the higher end. Death of fish is almost certain at a pH of less than 4.0 or greater than 11.0 (Abowei, 2010). In this study, pH ranged from 7.37 to 8.46 and 7.39 to 8.54 in greenhouse and open ponds respectively. This was within the acceptable range for fish culture in all the ponds. ponds prior to the commencement of the rains and vice versa from November onwards. This could have been due to surface run-off of water with inorganic ions into the open ponds from the ground around the open ponds since there were no bunkers constructed to prevent such inflows. Total dissolved solids are responsible for osmotic regulation of fluids in and out of organisms’ cells and are building blocks of the molecules necessary for life. There concentrations of chemical variables, other than chlorophyll a, between greenhouse and open ponds both before and after the commencement of rains. The implications are that modifications of the culture conditions for tilapia production, whilst greatly influencing physical water variables, have very little effect on the chemical variables. The concentration of unionised ammonium found in this study in both greenhouse ponds (0.18 mg/l) and open ponds (0.20 mg/l) were above the minimum ideal range for fish survival. Unionised ammonia concentrations of around 0.05 mg/l and below are not ideal for fish as they cause loss of equilibrium in fish, excitability and breathing distress through reduction in oxygen uptake and subsequent increased heart rate. Total phosphorus, alkalinity, turbidity, total suspended solids, sulphates and biological oxygen demand concentrations though higher in open ponds than in greenhouse ponds were not statistically different among the two sites. If there are high concentrations of phosphorus in natural water bodies’ undesirable algal blooms grow this is a sign of poor quality water leading to reduced oxygen concentration in ponds. The recommended range is 50- 150 mg/l as CaCO3 and the acceptable range of above 20 mg/l and less than 400 mg/l for ponds, (Santos et al., 2013) was achieved. were no significant differences in the There were no significant differences in dissolved oxygen between open and greenhouse ponds for all the sampled months. Dissolved oxygen levels in greenhouse ponds ranged from a low of 2.63 mg/l in September to a high of 4.48 mg/l in October whilst in open ponds it ranged from a low of 2.74 mg/l in September to a high of 4.42 mg/l in October. The low DO observed in September was expected since water temperatures were lowest during that month. The solubility of oxygen in the aquaculture ponds have been reported to decrease as temperature increases. This is a known relationship in limnology (Wetzel, 2001). Dissolved oxygen levels for all the other sampled months, at no less than 3 mg/l, were within the acceptable levels for aquaculture production. DO concentrations of less than 3 mg/l have been reported to be stressful to most aquatic organisms with fish mortalities observed at 1-2 mg/l (Lucas and Southgate, 2003). Conductivity is a measure of how well water can pass an electrical current and is an indirect measure of the concentrations of inorganic dissolved ions such as chloride, nitrates, sulphates, phosphate, sodium, magnesium, calcium, iron and aluminium. Conductivity and total dissolved solids are closely related (Wetzel, 2001). In this study, conductivity was significantly higher in greenhouse ponds than in open ponds before the commencement of rains in November and vice versa after the commencement of rains. The decrease in conductivity in open ponds after the commencement of rains could be attributed to increased direct inflow of rainwater into the ponds as they were not covered. This probably had a diluent effect on the levels of the dissolved inorganic ions which contribute to the property of conductivity. However, this trend was at variance with that of total dissolved solids (TDS). The concentrations of total dissolved solids were higher in open Acknowledgments Gratitude goes to the staff at Henderson Research Station, University of Zimbabwe departments of Biological Sciences and Animal Sciences without whose assistance this study would not have succeeded. Many thanks to Professor Nhiwatiwa for co-funding this project. References Abowei, J.F.N. (2010). Salinity, Dissolved Oxygen, pH and surface water temperature conditions in Nkoro 71
Journal of Aquaculture Engineering and Fisheries Research, 4(2), 64-72 (2018) Journal abbreviation: J Aquacult Eng Fish Res River, Niger Delta, Nigeria. Advance Journal of Food Science and Technology, 2, 16-21. Bartram, J., Balance, R. (1996). Water Quality Monitoring, A practical guide to the design and implementation of freshwater quality studies and monitoring programmes. E and FN SPON, Chapman & Hall, London. Brander, K.M. (2008). Global Fish Production and Climate Change. Proceedings of the National Academy of Sciences, 104(50), 19709-19714. Bronmark, C., Hansson, L. (1998). The biology of lakes and ponds. Oxford University Press, New York, pp: 50-51. Handeland, S.O., Imsland, A.K., Stefansson, S.O. (2008). The effect of temperature and fish size on growth, feed intake, food conversion efficiency and stomach evacuation rate of Atlantic salmon post-smolts. Aquaculture, 283, 36-42. Hirpo, L.A. (2013). Reproductive biology of Oreochromis niloticus in Lake Beseka, Ethiopia. Journal of Cell and Animal Biology, 7(9), 116-120. Kausar, R., Salim, M. (2006). Effect of water temperature on the growth performance and feed conversion ratio of Labeo rohita. Pakistan Veterinary Journal, 26(3), 105-108. Lucas, J.S., Southgate, P.C. (2003). Aquaculture: Farming Aquatic Animals and Plants. Aquaculture. Mallya, Y.J. (2007). The effects of dissolved oxygen on fish growth in aquaculture. United Nations University Fisheries Training Programme, Iceland. Final Report. Musal, S., Orina, P.S., Aura, C.M., Kundu, R., Ogello, E.O., Munguti, J.M. (2014). The Effects of Dietary Levels of Protein and Greenhouse on Growth, Behaviour and Fecundity (Oreochromis niloticus L.) broodstock. International Journal of Science and Research, 10, 2271-2278. Mustapha, M.K., Okafor, B.U., Olaoti, K.S., Oyelakin, O.K. (2012). Effects of three different photoperiods on the growth and body coloration of juvenile African catfish, Clarias gariepinus (Burchell). Archives of Polish Fisheries, 20, 55-59. Santos, V.B.D., Mareco, E.A., Dal, P.S.M. (2013). Growth curves of Nile tilapia (Oreochromis niloticus) strains cultivated at different temperatures. Acta Scientiarum, 35(3), 235-242. Wetzel, R.G. (2001). Limnology: Lake and river ecosystems. 3rd edn. San Diego, CA: Academic Press. of Nile tilapia 72