seasons
seasons. Air Pollution. Review. Name the bottom two layers of the atmosphere Troposphere, stratosphere 75-80% of atmosphere’s mass is in the __ Troposphere Distinguish between good and bad ozone good: stratosphere, UV; bad: troposphere, lungs.
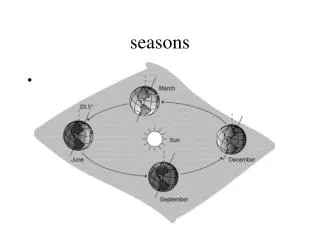

seasons
E N D
Presentation Transcript
Review • Name the bottom two layers of the atmosphere • Troposphere, stratosphere • 75-80% of atmosphere’s mass is in the __ • Troposphere • Distinguish between good and bad ozone • good: stratosphere, UV; bad: troposphere, lungs
PollutionThorpe, Gary S., M.S., (2002). Barron’s How to prepare for the AP Environmental Science Advanced Placement Exam • The term “Smog” (smoke and fog) was first used in 1905 to describe sulfur dioxide emission • In 1952, severe pollution took the lives of 5000 people in London • “It isn’t pollution that’s harming the environment. It’s the impurities in our air and water that are doing it.” FormerU.S. Vice President Dan Quayle www.aqmd.gov/pubinfo/ 97annual.html
December Very cold for several days People burned more coal Sulfur dioxide, particulates Killer London smog, 1952
Picadilly circus, London, winter, 1955 NOON London smogs
1952: Sulfur-laden smog covers London and is responsible for 4,000 deaths over a two-week period. 1967: Air Quality Control Act passed by Congress, setting timetables for states to establish their own air quality standards. 1970: Congress passes the Clean Air Act, allowing the newly created Environmental Protection Agency to set national air quality standards. Also allowed states to establish their own stricter standards, which California did. 1948: Air pollution inversion (cool air trapped by warm air above it keeps pollution from dispersing) in Donora, Pennsylvania, kills 20 people and makes 40 percent of the town's 14,000 inhabitants ill.
Clean Air Act 1970 • Amendments to an earlier act • ``To put the 1970 amendments in proper context, one needs to look back at Congress' prior efforts to control air pollution, particularly the Air Quality Act of 1967. That statute authorized the Secretary of Health, Education, and Welfare (who then had chief responsibility for federal environmental protection programs) to designate so-called air quality regions throughout the country; the states were given primary responsibility for adopting and enforcing pollution control standards within those regions. Some of us involved in the enactment of the 1967 statute had significant doubts as to the viability of the regional approach to air pollution control; after all, air contamination does not stop at neatly defined regional boundaries. Nevertheless, Congress as a whole and American industry were not yet convinced of the need for a national strategy for pollution control; therefore, as a first step, the 1967 statute's regional approach became the law of the land.’’ Paul Rogers, chair of House subcommittee on Health and the environment
Debate on Clean Air Act, 1970 • During House floor debate: • A representative quote a mayor: ``If you want this town to grow, it has got to stink.’’ • A common view then • Similar arguments continue to be made with respect to efforts to control global warming
Ozone Sulfur dioxide Lead Carbon monoxide Nitrogen dioxide Particulate matter Clean Air ActRequires EPA to set National Ambient Air Quality Standards (NAAQS) for six ``criteria’’ air pollutants
Primary Pollutants CO CO2 Secondary Pollutants SO2 NO NO2 SO3 Most hydrocarbons HNO3 H2SO4 Most suspended particles H2O2 O3 PANs 2 – NO3 and salts SO4 Most – Natural Sources Stationary Mobile
Major Sources of Primary Pollutants Stationary Sources • Combustion of fuels for power and heat – Power Plants • Other burning such as Wood & crop burning or forest fires • Industrial/ commercial processes • Solvents and aerosols Mobile Sources • Highway: cars, trucks, buses and motorcycles • Off-highway: aircraft, boats, locomotives, farm equipment, RVs, construction machinery, and lawn mowers
Natural air pollution • Who said the following: • "I have flown twice over Mount St. Helens out on our west coast. I'm not a scientist and I don't know the figures, but I have a suspicion that that one little mountain has probably released more sulfur dioxide into the atmosphere of the world than has been released in the last ten years of automobile driving or things of that kind that people are so concerned about.’’ • "Trees cause more pollution than automobiles do." • RONALD REAGAN
The facts: Volcanoes DO emit SO2. Kilauea much worse than Mount St Helens. MSH probably emits less than cars; Kilauea more (largest SO2 point-source emitter in the US). Volcanoes also put out particles and can cause health and climate effects Some air pollution does come from trees, decay. Typically, spread out and not a health risk, unlike anthropogenic sources Natural sources
Burning Fossil Fuels Using Nitrogen fertilizers and burning fossil fuels Refining petroleum and burning fossil fuels Manufacturing Adds CO2 and O3 to troposphere Global Warming Altering Climates Produces Acid Rain Releases NO, NO2, N2O, and NH3 into troposphere Produces acid rain Releases SO2 into troposphere Releases toxic heavy metals (Pb, Cd, and As) into troposphere Human Impact on Atmosphere www.dr4.cnrs.fr/gif-2000/ air/products.html
Criteria Air Pollutants EPA uses six "criteria pollutants" as indicators of air quality • Nitrogen Dioxide: NO2 • Ozone: ground level O3 • Carbon monoxide: CO • Lead: Pb • Particulate Matter: PM10 (PM 2.5) • Sulfur Dioxide: SO2 • Volatile Organic Compounds: (VOCs) EPA established for each concentrations above which adverse effects on health may occur
Nitrogen Dioxide (NO2) • Properties: reddish brown gas, formed as fuel burnt in car, strong oxidizing agent, forms Nitric acid in air • Effects: acid rain, lung and heart problems, decreased visibility (yellow haze), suppresses plant growth • Sources: fossil fuels combustion, power plants, forest fires, volcanoes, bacteria in soil • Class: Nitrogen oxides (NOx) • EPAStandard: 0.053 ppm
Ozone (O3) • Properties: colorless, unpleasant odor, major part of photochemical smog • Effects: lung irritant, damages plants, rubber, fabric, eyes, 0.1 ppm can lower PSN by 50%, • Sources: Created by sunlight acting on NOx and VOC , photocopiers, cars, industry, gas vapors, chemical solvents, incomplete fuel combustion products • Class: photochemical oxidants
Ozone (O3) • 10,000 to 15,000 people in US admitted to hospitals each year due to ozone-related illness • Children more susceptible • Airways narrower • More time spent outdoors
Carbon Monoxide (CO) • Properties:colorless, odorless, heavier than air, 0.0036% of atmosphere • Effects:binds tighter to Hb than O2, mental functions and visual acuity, even at low levels • Sources:incomplete combustion of fossil fuels 60 - 95% from auto exhaust • Class:carbon oxides (CO2, CO) • EPAStandard:9 ppm • 5.5 billion tons enter atmosphere/year
Lead (Pb) • Properties: grayish metal • Effects: accumulates in tissue; affects kidneys, liver and nervous system (children most susceptible); mental retardation; possible carcinogen; 20% of inner city kids have [high] • Sources: particulates, smelters, batteries • Class:toxic or heavy metals • EPAStandard: 1.5 ug/m3 • 2 million tons enter atmosphere/year
Suspended Particulate Matter (PM10) • Properties: particles suspended in air (<10 um) • Effects: lung damage, mutagenic, carcinogenic, teratogenic • Sources:burning coal or diesel, volcanoes, factories, unpaved roads, plowing, lint, pollen, spores, burning fields • Class: SPM: dust, soot, asbestos, lead, PCBs, dioxins, pesticides • EPA Standard: 50 ug/m3 (annual mean)
Sulfur Dioxide (SO2) • Properties: colorless gas with irritating odor • Effects: produces acid rain (H2SO4), breathing difficulties, eutrophication due to sulfate formation, lichen and moss are indicators • Sources:burning high sulfur coal or oil, smelting or metals, paper manufacture • Class: sulfur oxides • EPA Standard: 0.3 ppm (annual mean) • Combines with water and NH4 to increase soil fertility
VOCs (Volatile Organic Compounds) • Properties: organic compounds (hydrocarbons) that evaporate easily, usually aromatic • Effects: eye and respiratory irritants; carcinogenic; liver, CNS, or kidney damage; damages plants; lowered visibility due to brown haze; global warming • Sources:vehicles(largest source),evaporation of solvents or fossil fuels, aerosols, paint thinners, dry cleaning • Class: HAPs (Hazardous Air Pollutants) • Methane • Benzene • Chlorofluorocarbons (CFCs), etc. • Concentrations indoors up to 1000x outdoors • 600 million tons of CFCs
Makes effects of air pollutants worse Usually: sun warms air at Earth’s surface, which rises and mixes, dispersing pollutants Sometimes: layer of warm air above cooler, denser air, which does not rise and mix Temperature inversion
Ordinarily, warm air rises, carrying pollutants with it If colder air is under warmer air, the air is stable, and pollution can be trapped
Another kind of temperature inversion • Air warms up by compression as it flows downslope. Forms a ``lid’’ over colder air. This type of inversion common in Denver, which is to right of the mountains
Acid rain • Sulfur dioxide and nitrogen oxides react in atmosphere acidic chemicals that can travel long distances and return to earth • Tall stacks reduce local pollution, but increase regional
SEE TEXTBOOK, P. 445 Note: coal-burning plants in AZ, plume to NE
Erode metal and stone Acidifies lakes, leading to fish deaths Acidifies soil, leaching plant nutrients Acid rain impacts
For better Clean Air Act amendments of 1990 led to reductions in SO2 and Nox Cap-and-trade program For worse U.S. and China have huge coal reserves The future of acid rain
Smog • Photochemical smog • Air pollutants (VOCs, NOx) react under influence of sunlight and heat • Form: ground level ozone and other chemicals that together = smog • Industrial smog • A mixture of sulfur dioxide, sulfuric acid and particulates • Often in winter, with coal burning (eg: London)
Industrial smog in China • Bejing • China is home to 20 of the world’s top 30 most smog-plagued cities
DECREASE Local climate: rain and snow wash pollutants out; dry areas more prone Winds: mix pollutants or blow them away Salt spray from ocean: can remove particulates INCREASE Tall buildings reduce wind Hills and mountains High temperatures Factors influencing smog formation
Often: a GREATER threat to health than outdoor air pollution EPA studies: 11 common pollutants often 2-5x higher indoors May be higher in cars in urban areas People spend more time indoors Indoor air pollution
Indoor air pollution • Biggest problems • Formaldehyde: low levels emitted from many household products • Furniture, paneling and plywood, insulation • Radon: natural radioactive gas found in soil • Outdoors, disperses; indoors, may concentrate and contribute to lung cancer • Lead, asbestos, carbon monoxide, chloroform