Measuring Biodiversity
Measuring Biodiversity. Key Concepts: Species richness Species evenness Simpson’s Index of Diversity ( D ). Species richness. This is a qualitative description… Eg “how many different species can I see?” More species does not always mean more biodiversity…why not?.

Measuring Biodiversity
E N D
Presentation Transcript
Measuring Biodiversity • Key Concepts: • Species richness • Species evenness • Simpson’s Index of Diversity (D)
Species richness • This is a qualitative description… • Eg “how many different species can I see?” • More species does not always mean more biodiversity…why not? …because there may not be many individuals of each species (evenness)
Species evenness • This is a quantitative measurement • It is a measure of the abundance of individuals in each species.
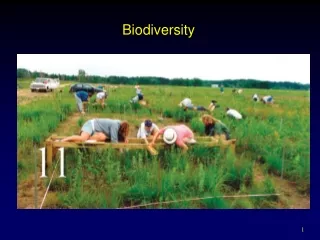
Abundance can be measured… • Pecentage cover – the proportion of each quadrat occupied by the species. • Population density – the number of individuals per quadrat • Species frequency – the proportion of quadrats with the species in it.
When both species richness and species evenness increase, there is by definition an increase in BIODIVERSITY.
Which field shows the most biodiversity? Both have the same ‘richness’ ( 6 species), but Field B has greater ‘evenness’; so Field B is more diverse.
Simpson’s diversity index (D) is a measure of biodiversity that takes into account richness and evenness. • A high value for D is ‘good’ and means the habitat is diverse, species rich, and able to withstand some environmental impact. • A low value for D is ‘poor’ and means the habitat is low in species, so a small change to the environment ( eg pollution) would have a serious impact.
Looks complex but it’s not..! D = 1 – [ ∑ ( n / N)2 ] n = number of individuals N = total number of individuals
Calculating Simpsons diversity index (D) D = 1 – [ ∑ ( n / N)2 ]
Calculating Simpsons diversity index (D) D = 1 – [ ∑ ( n / N)2 ]
Calculating Simpsons diversity index (D) D = 1 – [ ∑ ( n / N)2 ] D = 1 – 0.4308 D = 0.5692
Now calculate (D) for Field B… D = 1 – [ ∑ ( n / N)2 ]
Field B (D) D = 1 – [ ∑ ( n / N)2 ] D = 1 – 0.243 D = 0.757
Conclusion: • D for Field A = 0.5692 • D for Field B = 0.757 • “Field B has the higher diversity index, so has more species richness AND evenness. It would be more resistant to any environmental damage or change.”
Survey of animals in a freshwater stream. Calculate Simpsons diversity index D
Survey of animals in a freshwater stream. D = 1 – [ ∑ ( n / N)2 ]
Survey of animals in a freshwater stream. D = 1 – [ ∑ ( n / N)2 ] D = 1 – 0.299 = 0.7
“Explain this result” (3) • An index value of 0.7 means there is a high probability that any two individuals taken from this stream will be from different species. • The stream shows good species richness and evenness. • The stream is more likely to withstand changes such as pollution.
Measuring Biodiversity – self check • Do you know? • Species richness • Species evenness • Simpson’s Index of Diversity (D)