Download
1 / 19
190 likes | 432 Views
Climate Sensitive Individual Tree Growth Models for the Sierra Nevada Ecoregion: FVS-WESSIN. Tim Robards University of California, Berkeley Cal. Dept. of forestry & fire protection, Fire & resources assessment program. Collaborators. Prof. Greg Biging, UC Berkeley

E N D
Climate Sensitive Individual Tree Growth Models for the Sierra Nevada Ecoregion: FVS-WESSIN Tim Robards University of California, Berkeley Cal. Dept. of forestry & fire protection, Fire & resources assessment program
Collaborators Prof. Greg Biging, UC Berkeley Prof. John Battles, UC Berkeley Prof. Kevin O’Hara, UC Berkeley Dr. Martin Ritchie, USDA Forest Service, PSW Mr. Guido Franco, Cal. Energy Commission Dr. Adrian Das, USGS Dr. William Stewart, UC Berkeley Extension
Presentation Outline Objectives Model Structure Data Modeling Results Implementation in FVS Evaluation Projections
Objectives • Climate-sensitive forest growth simulator • Accurate projections for adaptation and mitigation research • Use best available data • Six species: PP, SP, IC, DF, WF, RF • Component of bi-annual climate change report • Evaluate climate change impacts to forest productivity • Mortality • FVS modified variant • Use available add-ons (FFE, pests) • Take advantage of work already done (volume, imputation) • Work with LMS or FVS carbon add-on for carbon projects
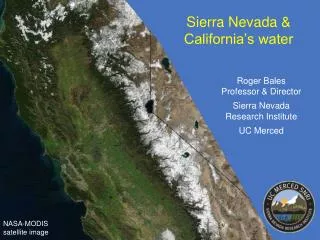
Data • Fit data • Climate data • PRISM • Monthly • 4x4 km grid • Evaluation data
Modeling • Linear mixed effects model • Random: temporal, spatial • Fixed: everything else • R statistical software • LME4 library (Bates 2007) • GRID Graphics • Equivalence library (Robinson 2007) • Bakuzis matrix library (modified from Johnson (2007)) • Criteria • AIC • Parameter significance (topography exception) • Residuals
Climate Variables Only red fir growth entirely negative to temperature increases More precipitation => more growth Degree-day variables generally better than straight temperature Height Growth
PP Ht growth Topography Stage and Salas (2007) formulation highly adaptable Requires wide range of data Requires high tolerance for insignificant parameter estimates DF Diam. growth
Implementation in FVS Source Code from USDA Forest Service, Forest Management Service Center, Ft Collins, CO Lahey-Fujitsu Express ver. 7.1 Fortran Compiler Additional input file for climate data Annual time steps, maximum of 80 Height and diameter growth models for 6 species No changes to outputs YEAR PRE_W PRE_P PRE_S PRE_WP PRE_PS MAXT5D MAXT5D_W MAXT5D_P MAXT5D_S MINT5D_W 1 10600 5739 7640 16339 6503 365 151 92 122 31 2 12189 2801 11030 14990 3904 365 151 92 122 3 12138 1363 4730 13500 1835 365 151 92 122 4 8022 3801 0470 11823 3848 365 151 92 122 31 5 13785 2507 9070 16291 3413 365 151 92 122 31 6 8199 5864 2960 14063 6160 365 151 92 122 31 7 10522 3045 2710 13567 3316 365 151 92 122 31 8 4300 2692 2140 6992 2906 365 151 92 122 9 11346 4333 8900 15679 5223 365 151 92 122 31
Evaluation • Model behavior evaluated using modified and reduced Bakuzis Matrix • Forest Types: PP, MC, DF, WF, RF • 10 x 10 spacing to 20 years in Conifers (Ritchie 2008) • PCT and no PCT • Flat ground, NE and SW aspects (30% slope) • Equivalence test using regression method (Robinson 2007) • 559 diameter, 167 height measurements • ± 25% • Reject null hypothesis that model and data different
Projections • 100-year projections • Downscaled climate (Scripps Institute, UCSD) • A2: CO2 850ppm max; self-reliance; population increases • B1: CO2 550 ppm max; global solutions; population plateaus • 4 GCMs • Elevation transect (Tahoe National Forest) • Other models in common area (Shasta County) • Climate sequestration project • LaTour State Forest (Southern Cascades) Westcarb Project • Statewide Assessment?
Questions/Comments Tim Robards tim.robards@fire.ca.gov 916.445.5342