Download
1 / 36
360 likes | 377 Views
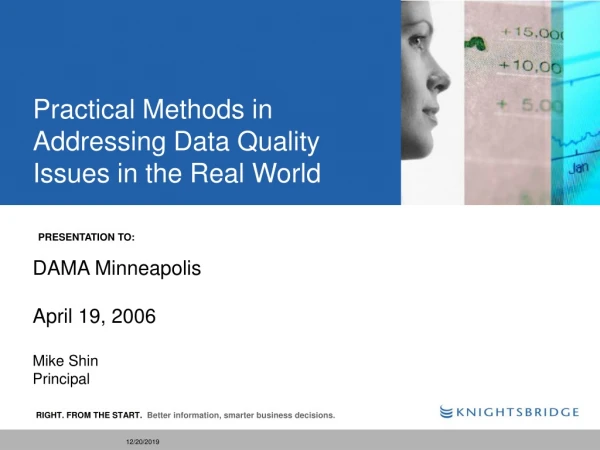
Practical Methods in Addressing Data Quality Issues in the Real World. PRESENTATION TO:. DAMA Minneapolis April 19, 2006 Mike Shin Principal. ABOUT THE SPEAKER.

E N D
Practical Methods in Addressing Data Quality Issues in the Real World PRESENTATION TO: DAMA Minneapolis April 19, 2006 Mike Shin Principal
ABOUT THE SPEAKER • Mike Shin has nearly 15 years of consulting experience, with five years of experience in implementing business intelligence (BI) solutions for customers mostly in Manufacturing and Finance • Areas of expertise include data warehouse design (e.g. applying star schema principals), assessment of front-end tools, dashboard development/design, report development and design, gathering user requirements, and architectural design and implementation • Knightsbridge is the largest professional services firm exclusively focused on the information management disciplines of business intelligence, data warehousing, data integration and information quality
STATUS QUO: UNFORTUNATE REALITY • Ideally all organizations understand the importance of clean data entry • From a data warehousing and reporting perspective, this data travels “downstream” and is costly to fix if errors exist • But the reality is that data quality is NOT yet viewed as an important enterprise objective • Only when the top-level executives demand simple reports across various line of businesses do data quality issues become very apparent
“SIDE-EFFECTS” OF POOR DATA QUALITY ARE COSTLY • According to a PriceWaterhouseCoopers Global Data Management survey… • 75% reported significant problems as a result of defective data • 50% had incurred extra costs due to the need for internal reconciliations • 33% had been forced to delay or scrap new systems • 33% had failed to bill or collect receivables • 20% had failed to meet a contractual or service-level agreement • Through 2007, more than 50% of data warehouse projects will have limited acceptance – if not outright failure – due to a lack of attention to data quality issues • The Data Warehousing Institute (TDWI) estimates that poor quality customer data costs US businesses a staggering $611 billion a year in postage, printing, and staff overhead -- Wayne Eckerson Director of Research, TDWI
POOR DATA QUALITY COSTS LIVES News headline: “CIA Fires Officer Blamed in Bombing of Chinese Embassy” Using outdated information, the CIA selected the address of an armory for a bombing target. At the time of the bombing, however, the building housed the Chinese Embassy. Result: tragic loss of life and property.” The New York Times April 9, 2000
DATA QUALITY IS AS MUCH A BUSINESS ISSUE AS A TECHNICAL ONE “….Projects do not fail for technical reasons, they fail on the issues that humans ought to be able to resolve and do not. Issues like data quality….” Mike Whitehome Business Intelligence Editor ServerManagement (formerly Enterprise Server Magazine)
AgendaIn today’s session, we’ll cover >What is data quality – and why is it important? A practical methodology to improve data quality Summary / Q&A
WHY IS ADDRESSING IT IMPORTANT? • Due to various compliance laws across all industries, executives now carry the onus of accounting for their organization’s policy and procedures, financials, and more importantly, its data • Basal II • Sarbanes-Oxley Act • By making data quality a strategic priority, an enterprise better positions itself to streamline operations, grow revenue, reduce costs, and achieve long-term competitive advantage
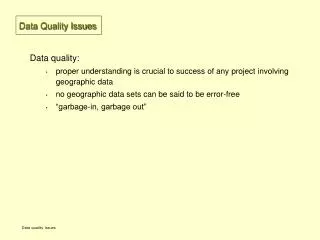
DATA QUALITY DEFINED • Most organizations incorrectly assume that data quality is defined simply as theaccuracy for a piece or set of data • However, the complete definition should include the manner in which data enters and flows through-out the enterprise. At a fundamental level, data quality is the suitability of the data for the intended use (e.g., “context”) • End-user satisfaction is directly tied to good data quality • The better the data, the more it is used • Thus, data quality is more than the identification of data errors and coming up with the appropriate fixes. It involves a cross-functional approach -- involving business users – to identify the root cause of bad data and developing controls to prevent it from happening in the future
ROOT CAUSES OF POOR DATA QUALITY • Company acquisitions • Poor data entry in operational/source systems
31 Downstream Systems 4 Upstream Systems WHY IS POOR DATA SO PREVALENT? Partner Company acquisitions! System 3 1 Profiler database replication 4 User Accessing Profiler (read-only) 3 System 1 System 2 Contract 2 2 System 4 Profile 5 System 5 Profile updates
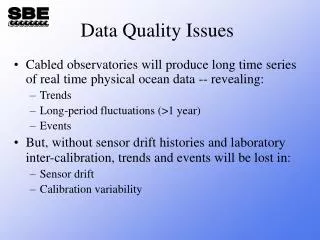
ERP Application Legacy Data Store Extract, Transform, Load Data Warehouse Legacy Systems Flat Files from External Sources Source Systems WHY IS POOR DATA SO PREVALENT? (CONT.) Operational systems support high volume transactions. In general, users do not have time nor the incentive to audit their data entry. Because this may not be realistically addressed, a systematic approach is required to mitigate errors ‘downstream”.
Agenda What is data quality – and why is it important? >A practical methodology to improve data quality Summary / Q&A
DATA QUALITY METHODOLOGY: IT IS NOT AN ENGAGEMENT Data quality is not a SWAT project • Addressing data quality requires an on-going commitment and investment (much like corporate security) • It is not a one-time project with a fixed start and end date • The following approach is very similar to Six Sigma: Define, Measure, Analyze, Improve, Control……..
A PREVIEW OF THIS SECTION • Sample methodology • Sample data management flow: Validate/Measure, Remediate, and Certify • Realistically, “remediation” requires a systematic approach • Data quality is a product: You must sell it! • Sell to the end-users • Sell to the executives • Leverage existing BI tool (obtain better ROI)
DATA QUALITY METHODOLOGY: ADDRESSING POOR DATA An effective data quality framework will track progress over time so that users will ultimately trust the information they are seeing • Data profiling • Perform initial benchmark • Quantify results • Monitor progress over time • Communicate with users • Data source analysis • Perform systems (SOR) inventory • Identify systems only supporting business needs (context-oriented approach) • BI tool • Utilize existing tool tracking capabilities if it exists • Track usage over time – Metadata Services Master Data Management Services Suppliers Consumers Distribution Services Acquisition & Authoring Services • “Systematic” approach • Identify cause, not symptom, of data quality if possible • Data management process: Extract, validate, remediate, transform, load, certify, and publish • Prevent bad data from re-occurring Data Quality Services Administration Maintenance • Executive sponsorship • Provides funding • Provides resources/time • Develops data quality team • OR, develops team of “part-time” permanent staff Services Services • End-user education • Constantly obtain user feedback • Users determine priorities
1 3 4 Extract Remediate Transform 5 6 Load Certify 7 Publish DATA QUALITY METHODOLOGY: ADDRESSING QUALITY ISSUES The Data Management Process 2 Validate Start Stop Today, we will cover only Validate, Remediate, and Certify steps
DATA QUALITY METHODOLOGY: DATA SOURCE ANALYSIS • First, identify the business problem area (e.g., HP PRM group had issues with turn-around times in claims payments to the top 10 Tier 1 partners) • If possible, quantify how big the problem is in dollars • Executive sponsorship/management only understands $ • Take inventory of all data sources that support the business process(es) under investigation • Identify all appropriate system of records (SOR) • Some systems of record may not even be accessible • Do not waste clean-up efforts on data that does not impact users • “Time is money”
DATA QUALITY METHODOLOGY: MEASURING • Now that all of the data sources have been identified, determine the degree of “cleanliness” (e.g., usability) of the data • Determine the rules that will govern the data (“horizontal measures”): • Reporting tool statistics (provides indirect gauge to data quality): % users, % of reports used • # missing elements (e.g., missing zip codes) • # invalid values/codes (e.g., for gender field, field displays “U”) • # invalid fields (e.g., last name typed in first name field) • # unparsed fields (e.g., first and last name appearing in first name field) • # of duplicate fields (e.g., duplicate partner names) • “Vertical measures”: • Finance (Application received date > Loan funded date) • Correct loan stages: Quote, App Sent/Received, Approved, Funded • Healthcare (Admission date > Charge date) • Manufacturing (Allocated funds date > Payment date)
DATA QUALITY METHODOLOGY: MEASURING (CONT.) • Perform basic data quality scoring • Scoring will represent the state of the data quality for a particular rule • System scores will be an aggregate of the rule scores for that system • Finally, the overall score will be an aggregation for all systems: • Adherence / possibilities • Ex: If 94% of genders column conform correctly to rule, then score is 94
DATA QUALITY METHODOLOGY: MEASURING (CONT.) • Weighted average may be taken (in order to account for more important business rules) when calculating overall system of record score
DATA QUALITY METHODOLOGY: MEASURING (CONT.) • Business and IT should develop an agreed-upon grading system (as part of Service Level Agreement): Communicate with the end-users
1 3 4 Extract Remediate Transform 5 6 Load Certify 7 Publish DATA QUALITY METHODOLOGY: ADDRESSING QUALITY ISSUES The Data Management Process 2 Validate Start Stop
Data Warehouse DATA QUALITY METHODOLOGY: APPLY SYSTEMATIC APPROACH • If possible, identify/fix root cause of data issue at original data source (e.g., operational data source) during Remediation phase • Ex: Preventing users from entering free text in operational application • Realistically, though, address in “downstream” layer (in the following order): • Data stage area (using data quality software) • Extract, Transform, and Load layer • Semantic layer of BI tool • BI/Report layer (DO NOT HARD-CODE) Ideally, root causes are addressed at operational layer. This way, errors do not propagate to other systems, including the data warehouse. Data quality issues must be fixed prior to impacted use.
1 4 Extract Transform 5 6 Load Certify 7 Publish DATA QUALITY METHODOLOGY: ADDRESSING QUALITY ISSUES The Data Management Process 2 3 Validate Remediate Start Stop
DATA QUALITY IS A PRODUCT: BELIEVE IN IT! • Sell to user community • Sell to the executives
DATA QUALITY METHODOLOGY: SELL, SELL, SELL • Good quality data is a product….sell this to the end-user community • When good quality data is present, good ROI results for BI tool as well • During the BI tool training, educate end-users on the how/why bad data quality usually occurs • Sample architecture overview: • Migrating the data • Cleansing the data • Transforming the data • Loading the data warehouse • Reconciling the data warehouse
DATA QUALITY METHODOLOGY: EXECUTIVE SPONSORSHIP • Executive committee should be providing resources/time • Realistically, all team members are “part-time” (they all have other full-time jobs elsewhere in the company) • In order to keep data quality efforts moving forward, always provide ROI figures to executive sponsors (they only understand $$$$$$):
DATA QUALITY METHODOLOGY: EXECUTIVE SPONSORSHIP (CONT.) • As this example illustrates, there is an ideal DQ score, not necessarily the highest DQ score. The benefit of incrementally increasing the DQ score further diminishes.
DATA QUALITY METHODOLOGY: EXECUTIVE SPONSORSHIP (CONT.) • At a manufacturing client, Inventory report is utilized for both forecasting and increasing Inventory turns (e.g., the less inventory on-hand, the better) • Inventory report was understating inventory on-hand at one site • Data integrity team discovered root cause and applied necessary Remediation steps • Data integrity team tracked usage of report (using existing BI tool) after appropriate fix was made • Rather than purchasing parts/sub-components from suppliers, inventory was shifted from excess site to site in need ($$$$$$$$$$ saved)
1 3 4 Extract Remediate Transform 5 Load 7 Publish DATA QUALITY METHODOLOGY: ADDRESSING QUALITY ISSUES The Data Management Process 2 Validate Start 6 Certify Stop
DATA QUALITY METHODOLOGY: LEVERAGE EXISTING BI TOOL • Overall usage of existing reporting (ie, BI tool) provides an indirect gauge as to the quality of the data presented • Sample metrics that should also be reported to executive sponsorship: • # of “active” users/# of total users • # of “active” reports/# of available reports • Top 10 reports, bottom 10 reports (may not even be utilized) • Reach out to end-users: BE PROACTIVE! • Most users do not raise data quality issues • Most users assume that the existing reporting tool is not working properly when data issues arise
Agenda What is data quality – and why is it important? A practical methodology to improve data quality > Summary / Q&A
SUMMARY P • Understand the cost of having poor data quality • Address data quality as an on-going, long-term commitment • Educate end-users on root causes of data quality issues (“upstream” vs “downstream”); Sell the benefits of good data quality • Fix only data that is relevant to end-users (“context-oriented” approach) • Quantify progress to executive sponsors • Apply systematic approach during remediation step P P P P P
FINAL THOUGHTS….. “The success of a data warehouse rests with the users’ perceptions of it.” “If the data is incorrect or incomplete, user confidence and use of the data warehouse will diminish.” - Jonathan Wu Senior Principal, Knightsbridge Solutions
THANK YOU Mike Shin Principal 408-504-5050 mshinn@knightsbridge.com Fortune 500 companies and other large data-centric organizations turn to Knightsbridge for consulting services for their most difficult data problems—problems rooted in massive data volumes or complex information challenges. Our clients rely on us to deliver actionable and measurable business results that inform decision making, optimize IT efficiency, and improve business performance. Knightsbridge data solutions focus exclusively on the information management disciplines of data warehousing, data integration, information quality, and business intelligence. With proven methodologies, the best consulting staff in the industry, industry-specific business knowledge, and deep expertise in the tools and technologies for managing complex data environments, we deliver practical solutions that reduce time, reduce cost, and reduce risk. Knightsbridge maintains offices in Chicago, San Francisco Bay Area, New York Metro, Houston, Washington, DC and London. To learn more, visit us at www.knightsbridge.com.