Analyzing Unbalanced Classes with K-means Clustering and Machine Learning Models
This document explores the challenges of handling unbalanced class data using K-means clustering. It delineates two classes based on attribute values that determine their membership. The larger size of Class 2 in the test set reflects real-world scenarios. Using various machine learning models, we assess classification performance, highlighting results from MLP and AdaBoost with different data set combinations. These analyses aim to uncover how often certain attributes arise across classes, ultimately improving predictive modeling critiques.

Analyzing Unbalanced Classes with K-means Clustering and Machine Learning Models
E N D
Presentation Transcript
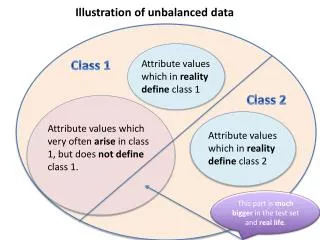
Illustrationofunbalanced data Class 1 Attributevalueswhich in realitydefineclass 1 Class 2 Attributevalueswhichveryoftenarise in class 1, butdoesnotdefineclass 1. Attributevalueswhich in realitydefineclass 2 This part is muchbigger in the test set and real life.
Clusters K-means K=3 Cluster 2 Cluster 1 (185) (153) 27 135 76 48 50 1 Cluster 3 (160) 13 10 Classified As: Good, Guard Down 139 Good Bad
By Victoria, October 20 Good: 141 Good, Guard Down: 171 Bad: 183 Total: 496 kicks
By Svenn, November 9 Good: 12 Good, Guard Down: 26 Bad: 18 Total: 56 kicks
By Victoria, November 8 Good: 15 Good, Guard Down: 10 Bad: 19 Total: 44 kicks
Right shoulder, up-down, frame 1 1 Right shoulder, front-back, frame 1 2 Good Kick 3 Right shoulder, front-back, frame 6 Good Kick Guard Down 4 Attribute 250 Attribute 251 Bad Kick 163 Attribute 322 164 Attribute 323 LeftKnee, front-back, frame 6
Sorry, this one’s not in original PP format, If you want to customize it I’d advise To edit the previous slide.
Iteration 3 Generate models and test on Data set 2. Just MLP + Data set 1 AdaBoostM1 84% AdaBoostM1 + Data set 1 80% Just MLP + Data set 1 + Data set 3 + 89% AdaBoostM1 + Data set 1 + Data set 3 86%