Download
1 / 1
10 likes | 77 Views
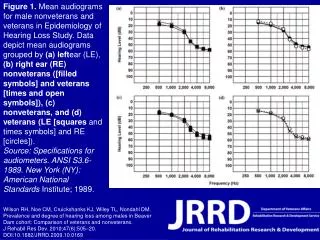
This figure displays mean audiograms for male nonveterans and veterans in an Epidemiology of Hearing Loss Study. The data illustrates the mean audiograms grouped by left ear and right ear for both nonveterans and veterans. Source: Specifications for audiometers, ANSI S3.6-1989. Wilson RH, et al. J Rehabil Res Dev. 2010.

E N D
Figure 1. Mean audiograms for male nonveterans and veterans in Epidemiology of Hearing Loss Study. Data depict mean audiograms grouped by (a) leftear (LE), (b) right ear (RE) nonveterans ([filled symbols] and veterans [times and open symbols]), (c) nonveterans, and (d) veterans (LE [squares and times symbols] and RE [circles]). Source: Specifications for audiometers. ANSI S3.6-1989. New York (NY): American National Standards Institute; 1989. Wilson RH, Noe CM, Cruickshanks KJ, Wiley TL, Nondahl DM. Prevalence and degree of hearing loss among males in Beaver Dam cohort: Comparison of veterans and nonveterans. J Rehabil Res Dev. 2010;47(6):505–20. DOI:10.1682/JRRD.2009.10.0169