Download
1 / 32
360 likes | 574 Views
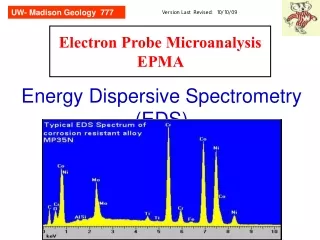
EDS Energy Dispersive Spectroscopy. Background Theory. Introduction to the EDS System Hardware & Software X-Ray Signal Generation Signal Origin, Spatial Resolution, Direction of Signal, Sample Surface EDS Instrumentation & Signal Generation

E N D
Background Theory • Introduction to the EDS System • Hardware & Software • X-Ray Signal Generation • Signal Origin, Spatial Resolution, Direction of Signal, Sample Surface • EDS Instrumentation & Signal Generation • Detector and geometry efficiency, Signal processing, Energy Resolution, Collimation
Introduction to the EDS System • Hardware • Software
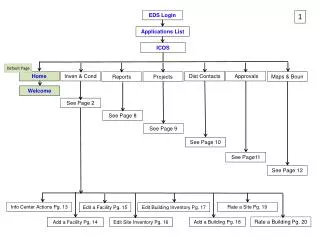
Hardware Schematic SEM Column Monitor (MCA Display) Dewar FET Preamp Chamber Pole Piece HP Computer Detector EDAM III Window PCI Collimator Sample Stage
Processing Schematic Spectrum Interpretation Electron Beam Signal Processing Beam- Specimen Interaction Signal Detection X-Ray Signal
X-Ray Signal Generation • Signal Origin • Spatial Resolution • Directionality of Signals • Analysis of Rough Surfaces or Particles
Bohr Model of the Atom (a simplified view) ---where X rays come from La Lb Ka Kb Ma Real life spectra are more complex because there are multiple orbitals (esp. for the L, M and N orbitals). L-series spectra in EDS can have 6 or 7 peaks. Nucleus
Chart of Lines visible 0-10 kV • K Lines - Be (Z=4) to Ga (Z=31) • L Lines - S (Z=16) to Au (Z=79) • M Lines - Zr (Z=40) to the highest occurring atomic numbers. Every element (Z>3) will have at least one line viewable between 0.1 and 10 keV. In some overlap conditions it might be necessary to examine the area between 10 and 20 keV.
Interaction Volume Regions primary beam sample surface se bse This diagram is somewhatmisleading. High-energy and low-energy x rays behave very differently (just like e-). x-rays High energy x rays can not be excited at great depths. Low energy x rays can be excited at great depths, but will most likely be absorbed and will not escape.
SE vs BSE Images SE -- Edge effect, charge sensitive, very little Z contrast. BSE --Z contrast dominates, no edge effect, no charging seen.
X-Ray Spatial Resolution Low Z Spot size does not determine the reso-lution but kV and Z are more significant. High Z Low kV High kV
Signal Resolution • Signal resolution (se) is determined by the width of the electron beam (spot size) and is proportional to the signal depth. x-ray se bse sample surface se bse x-rays
Directionality of Signals • SE Signal - attracted to positive voltage on wire mesh network in front of detector. • BSE Signal - Detector is arranged to collect signals from a large, symmetrical area. • X-ray Signal - most directional of all signals, only one detector with no way to influence the trajectory of x-rays
Spectrum Anomalies Detector Electron Beam Backscatter electrons Fluorescence X-rays Specimen Matrix Interaction volume Absorption of x-rays
Directionality of X-ray Signal Detector Direction A B C stage/mount sample Topography has a significant effect on spectrum count rate and on composition (take-off angle and absorption effects)
A= Lower low end peaks B= Normal C= Higher low end peaks B C A 3 different spectra at 3 locations on the same particle with a uniform composition. Take-off angle is highest at C and lowest at A.
Effects of Tilt (FeCO3) Peaks are autoscaled to the O K peak. Q: What if they were scaled to the background area? A: FeK same height, C K, O K and FeL would be higher at +30 degrees.
EDS Instrumentation & Signal Detection • X-Ray Detectors • The Detector Efficiency • Geometrical Efficiency • Signal Processing • The Signal Processor • Energy Resolution • Collimation
X-section of window & crystal (sapphire) -500 to 1000 volts +,- charges x-ray (photon) microscope vacuum to preamplifier (FET) Detector Vacuum Detector SiLi Detector Window 8u Be or 0.3u Polymer Metallization Layer,(85 angstroms) plus the Si dead layer
Detector EfficiencyWindow Transmission Capabilities I / Io = e -(mr t) Where : I = Final Intensity Io = Initial Intensity m = mass absorption coefficient r = density t = thickness
Mass Absorption Coefficient N Ka Energy Absorption edge or critical excita- tion energy Absorption (Kab) C C Ka Energy 0.284 X-ray Energy (keV)
Absorption evidence in Spectra The background is lower on the high-energy side due to absorption in the sample.
Solid Angle W = A/d 2 Where: A= detector area, mm 2 d = the sample to detector distance The solid angle (omega) is in steradians. Count rate at 70 mm scale setting = 1/4 that at 50 mm.
The Preamplifier 50 ns/x-ray event C Output FET Ultimate peak measurement time will be about 50 us (1000x 50 ns) Reset Detector
Output signal of anX-Ray Event (or 3 events) Higher dead time (all rejected) Voltage (mv) Lower dead time v Time Multiple x-ray events too close to each other will be rejected.
Throughput Curves Lesson: High count rates and high dead times actually give fewer counts and poorer spectra. You might consider a faster time constant.
Resolution Equation FWHM= SQRT[(FWHM)noise2 + (2.35 FEe)2] Where: F = fano factor= 0.11 E = energy of the x-ray, ev e = 3.8 ev/charge pair (Si), 2.96 ev/charge pair (Ge)
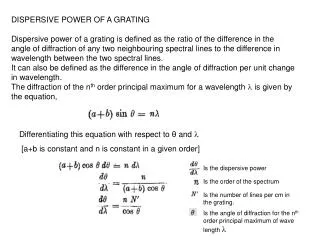
Collimators Be Window with no magnets (BSE do not penetrate) SUTW or UTW Window with magnets (shown in yellow) to deflect BSE If BSE reach the detector they will produce background anomalies --a hump in the background at high energies.