Week 10 Power: Energy Options for a Global Society
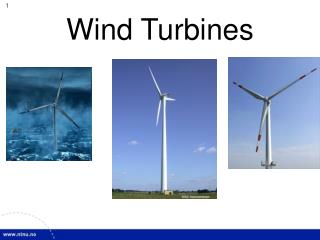
Week 10 Power: Energy Options for a Global Society Renewable Energy Principles and Applications II: Wind & Geothermal Power Wind Modern wind technology is already competitive with fossil fuels. Its ultimate limitations are only due to its intermittency. Resource Potential Power


Week 10 Power: Energy Options for a Global Society
E N D
Presentation Transcript
Week 10Power: Energy Options for a Global Society Renewable Energy Principles and Applications II: Wind & Geothermal Power
Wind Modern wind technology is already competitive with fossil fuels. Its ultimate limitations are only due to its intermittency. • Resource Potential • Power • Swept Area • Rotor Design • Wind Speed Distributions • Power Increase with Height
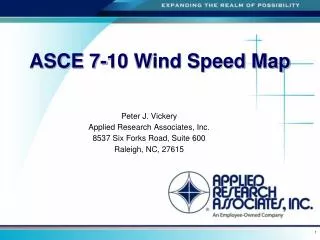
Wind Resource Potential is Currently Being Mapped at Very High Resolution Old Map New Map
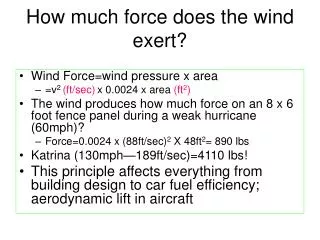
Wind Power • The power in the wind is: Power = ½ rA V3 • Using the density of air at sea level: Power = 0.6125 AV3 (metric) Power = 0.00508 AV3 (mph, ft)
Example • Calculate how much more power is available at a site where the wind speed is 12 mph than where it is 10 mph • P ~ V3 • P2/P1 = (V2/V1)3 • P2 = (12/10)3P1 = 1.73 P1 1.7 x the power (almost a factor of 2 increase), with only 2 mph increase in wind speed!
Swept Area • Power in the wind is also proportional to the swept area A = pR2 • Increase the radius from 10 m to 12 m: A2 = (R2/R1)2 A1 A2 = (12/10)2 A1 = 1.44A1 Nothing tells you more about a wind turbine’s potential than the rotor radius.
Rotor Designs • Two blades are cheaper but do not last as long • Three blades are more stable and last longer • Options include: • Upwind vs downwind • Passive vs active yaw • Common option chosen is to direct the rotor upwind of thetower with a tail vane
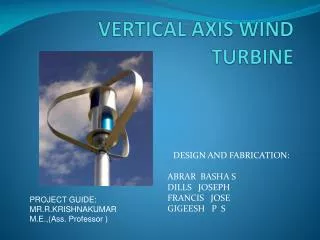
Darrieus Vertical Axis Fan Mill Horizontal Axis
Specifications Vestas V82 (V66) • Two Speed Cut-in Wind Speed: 2.5-3.5 m/s (7 mph)Rated Power: 900 KW - 1.65 MWCut-out Wind Speed: 32 m/s (75 mph) • Type: 3 Blade UpwindRotor Diameter: 82 m (270 ft.) Swept Area: 5281 m2 Rotor Speed: 10.8-14.4 rpm
The lift force (only) turns windmill blades for useful power output • Can think of a windmill as a fan running backwards. • The pitch of the blade causes a difference in air pressure on either side. • This difference in air pressure is what provides the “lift force” (similar to aircraft), and causes the rotors to turn.
Wind Drag • If the angle of attack of a blade is too large, the wind simply pushes against the blade, exerting a drag force but no lift. When the drag is too great, a stall occurs. • Wind mills are designed to operate in winds up to 35 mph, but must be able to survive 100 mph gales. • Random turbulent winds create strong torques that can fatigue the structure.
Wind Speed Frequency Distribution • Wind speeds occur at different values • Total energy from a turbine depends heavily on the maximum speeds because Power increases with the cube of the speed “The average of the cubes is greater than the cube of the average.”
Approximating Wind Distribution Using Rayleigh Distribution • Suppose we only know average speed • e.g. 12.8 MPH (5.7 m/s) • Wind has been observed to follow a Rayleigh distribution in many places, i.e. Prob. (Windspeed < v) = 1 – exp[(-/4)(v/vaverage)2] e.g. P (0) = 0, P (300 MPH) = 1
Wind Power • The power in the wind is: Power = ½ rA V3 • Using the density of air at sea level: Power = 0.6125 AV3 (metric) Power = 0.00508 AV3 (mph, ft)
A Utility-Grade 1.65MW Turbine A = 5281 m2 • @4.5 m/s • Power = 0.6125 AV3 = 295 KW • @5.5 m/s • Power = 0.6125 AV3 = 538 KW • @ 6.5 m/s • Power = 0.6125 AV3 = 888 KW
Wind Speed Frequency Distribution Total energy from a turbine depends heavily on the maximum speeds because Power increases with the cube of the speed
Wind Speed & Power Curves Rayleigh Distribution Turbine Power Profile Cut-in Speed
Wind Speed & Power Curves Total Energy in 1 Year: ~1.7 million kWh Blades will be turning: 80-90% of time Cut-in Speed 2.5 m/s (5.6 mph) Cut-out Speed 32 m/s (72 mph)
Vestas V82 Power Profile Wind Speed m/s
Power Increases With Height V2 = (H2/H1)aV1
How to calculate wind speed increase with height • Conservative Approximation: V2 = (H2/H1)aV1 • a is the Roughness exponent • Smooth terrain value (water or ice): 0.10 • Rough terrain value (suburb woodlands): 0.25 • Grasslands: 0.14
Example • Consider doubling the height of your tower from 10 m to 20 m. V2 = (H2/H1)aV1 = (20/10).14 V1 = 1.1V1 • The power available increases to: P2 = (H2/H1)3aP1 = (2)3aP1 = 1.34P1 • If you multiply height by a factor of 5: P2 = (H2/H1)3aP1 = (5)3aP1 = 1.97P1
Example • You live in a forested area. Calculate how much more power you can get from a turbine at 87meters than a turbine at 30meters. V2 = (H2/H1)aV1 = (87/30).25 V1 = 1.3V1 • The power available increases to: P2 = (H2/H1)3aP1 = (2.9)3(.25)P1 = 2.22P1
Efficiency • Small wind turbines can seldom deliver more than 30% of the energy in the wind • Most people live where average wind speeds are 4-5 m/s (9-11 mph) • Strangely, at extremely windy sites small wind turbines produce more energy but are less efficient at capturing the energy in the wind (10%) • Very important to locate turbines where winds speeds are highest and turbulence is at a minimum
High technology large turbines can achieve up to 46% efficiency • The spinning of a windmill causes a “backwind” which is maximum at the blade tip. • This affects the efficiency of the turbine. • Thus, one factor in the design is the tip speed vs. wind speed ratio.
Wind Power Resource Potential • Potential includes all the • factors we’ve covered: • wind speed • wind speed distribution • roughness of terrain • height of rotors • wind turbulence • etc. • Most turbines do not operate • at full capacity – 20% is typical
Factors to Consider When Designing a Wind System: • Company specs relevant to the machine only • Company specs may claim 2.4 KW • But does the wind carry that much power? • The site must be tested for wind speed optimization, turbulence minimization • Height of turbine • Design of turbine • Wind speed at which the rotor furls
Hybrid Systems • Wind turbines effective at night and in stormy weather • Both effective on a windy day • Solar effective on a clear windless day
Wind Farms • Wind farms funded in the 1980s helped tremendously to mature the technology to make wind power competitive with traditional fuels • California gave huge tax incentives for wind farms • Largest turbine produced 3.2 MW
Colorado Europe California
1. Madison Windpower, LLC • Town: Madison • County: Madison • Project Owner: PG&E Generating • # of Turbines: 7 • Turbine type: Vestas V66- 1,650kW • Rotor Diameter: 66m • Hub Height: 67m • Total Capacity (MW): 11.55 • Annual Expected Energy (MWh): 24,000
2. Wethersfield • Town: Wethersfield • County: Wyoming • Project Owner: CHI Energy, Inc. • # of Turbines: 10 • Turbine type: Vestas V47-660kW • Rotor Diameter: 47m • Hub Height: 65m • Total Capacity (MW): 6.6 • Annual Expected Energy (MWh): 19,000
3. Fenner Windpower, LLC • Town: Fenner • County: Madison • Project Owner: CHI Energy Inc. • # of Turbines: 20 • Turbine type: GE Wind- 1,500kW • Rotor Diameter: 70.5m • Hub Height: 65m • Total Capacity (MW): 30 • Annual Expected Energy (MWh): 89,000
More about Fenner • Noise from individual turbines: 50 dbA (as measured from closest non-site owned area) • Comparable to hearing airplane in distance • Area: 2000 acres • Average wind speed: 17mph • Total height: 328 feet • Weight: 375,000 pounds • Resident response: mostly positive: educational, clean, approve of appearance,
4. Calverton • Town: Calverton • County: • Project Owner: Long Island Power Authority • # of Turbines: 1 • Turbine type: AOC 15/50 • Rotor Diameter: • Hub Height: • Total Capacity (MW): 0.5 • Annual Expected Energy (MWh):
5. Lorax-Energy • Town: • County: • Project Owner: Harbeck Plastics • # of Turbines: 1 • Turbine type: Fuhrlaender 250 • Rotor Diameter: • Hub Height: • Total Capacity (MW): 0.25 • Annual Expected Energy (MWh):
Tax Incentives • The Renewable Energy Production Incentive entitles Wind and PV systems to annual incentive payments of 1.5 cents per kilowatt-hour (1993 dollars and indexed for inflation) for the first ten year period of their operation, subject to the availability of annual appropriations in each Federal fiscal year of operation. - www.dsireusa.org. • For our turbine, this could mean 1.7 million kWh * 1.5 cents/kWh = $25,500 per year