Spectrophotometer
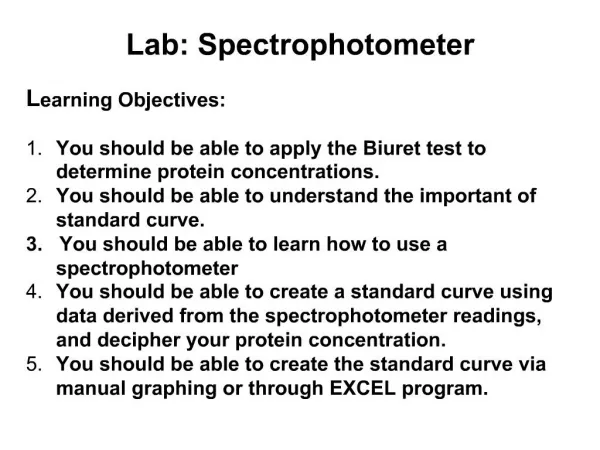
Spectrophotometer. Two methods to detect molecules:. Indicator – Quickest method. Indicator solutions change colors when a molecule of interest is present. Allows scientist to detect colorless molecules in a solution. Examples: Bradford protein reagent Diphenylamine (DPA) or

Spectrophotometer
E N D
Presentation Transcript
Two methods to detect molecules: • Indicator – Quickest method. • Indicator solutions change colors when a molecule of interest is present. • Allows scientist to detect colorless molecules in a solution. • Examples: Bradford protein reagent Diphenylamine (DPA) or Biuret (NaOH+CuSO4). What kind of data is this? Qualitative!
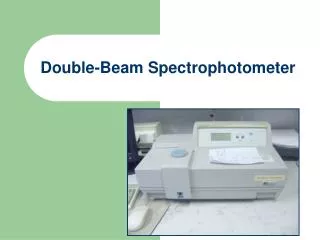
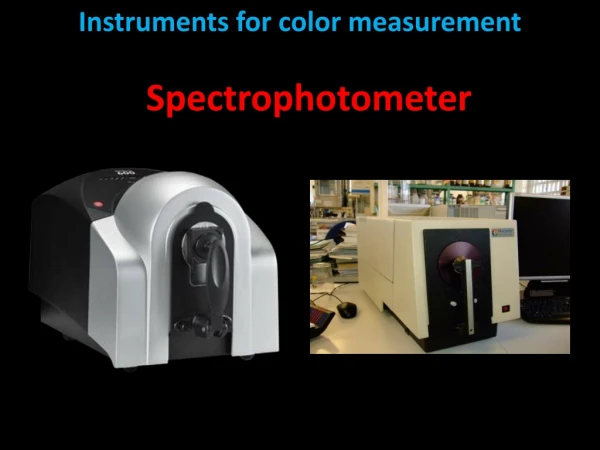
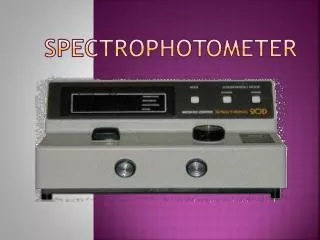
Two methods to detect molecules: • Spectrophotometer (Spec) • An instrument that measures the amount of light that passes through (is transmitted through) a sample.
Spectrophotometer cont… • Uses a type of light to detect molecules in a solution • Light is a type of energy, and the energy is reported as wavelengths, in nanometers (nm).
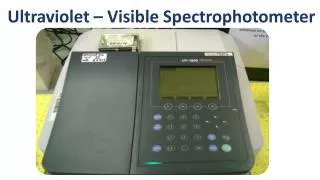
Two different types of Spectrophotometer: • Ultraviolet (UV) Spectrophotometers. • Uses ultraviolet light of wave lengths from 200 nm to 350 nm. • Visible (VIS) Light Spectrum Spectrophotometers. • Uses visible light (white light) of wave lengths from 350 nm to 700 nm.
The visible light spectrum Y R O G B I V
Spectrophotometer cont… • Shines a beam of light on a sample. • The molecules in the sample interact with the light waves in of 3 ways: • Absorb the energy • Reflect the energy • Transmit the energy between and through the atoms and molecules of the sample.
But why is the Box Blue? Blue molecules are blue because they reflect blue light. Blue molecules absorb the other colors of visible light.
How a spectrophotometer works: • Consider blue molecules, all the wavelengths of light are absorbed, except for the blue ones. • The blue wavelengths are transmitted or reflected off the molecules. If these blue wavelengths hit a detector (such as in the spectrophotometer or the nerve cells in your eye), they appear blue.
How a spectrophotometer works: • Molecules are whatever color of light that they do not absorb. • Green molecules appear green because they absorb most wavelengths of visible light, except the green wavelengths.
Spectrophotometer cont… • The spectrophotometer measures the amount of light transmitted through the sample (Transmittance). • By using an equation (Beers law), it converts the transmittance data to an absorbance value. What kind of data is this? Quantitative!
Spectrophotometer cont… • The concentration of an unknown sample can be determined by comparing the absorbance data to standards of known concentration. • The data generated with the set of known standards is called a standard curve.
Parts of a spectrophotometer • Inner parts • Lamp • Prism or grating that direct light of a specific wavelength.
VIS Spec vs. UV spec • Visible spectrophotometer • Contains a tungsten lamp that produces whitelight. • Ultraviolet spectrophotometer • Contains a deuterium lamp that produces light in the UV light part of the spectrum.
Parts of a Spectrophotometer • Outer parts: WavelengthSelection Display Sample Holder Knobs or buttons used to calibrate the spec to measure the designated molecule.
How a spectrophotometer works: • Visible Spectrophotometer • White light hits the prism or grating, it is split into the colors of the rainbow (Visible Spectrum). • The wavelength knob rotates the prism/grating, directing different color of light toward the sample.
How a spectrophotometer works: • The wavelength of light produced by the tungsten lamp range from about 350 nm (Violet light) to 700 nm (red light). • The molecules in the sample either absorb or Transmit the light energy of one wavelength or another.
How a spectrophotometer works: • The detector measures the amount of light being transmitted by the sample and reports that value directly (% transmittance) or converts it to the amount of light absorbed in absorbance units (au) using Beers Law.
Beers Law aka Beers Lambert law(No You Don’t Need to Memorize it….YES you need to write it down!) A = 2 – log10%T
Absorption Spectrum • After collecting data for your concentration an absorption spectrum graph is created. • These can be used when attempting to identify unknown substances (e.g. CSI)
The Absorbance Spectrum The absorbance spectrum is a graph of a sample’s absorbance at different wavelengths.
Example of absorption spectrum of Chlorophyll a & b, and Carotenoids
The function of a spectrophotometer The spectrophotometer can measure the amount of absorbance or lack of absorbance of different colored light for a given molecule.
The relationship of concentration in a solution: • The concentration of molecules in a solution affects the solution’s absorbance. • Remember [ ] is a ratio – when we change one number – it affects the ratio • If there are more molecules in one solution than in another, than there are more molecules to absorb the light.
Applications of a spectrophotometer • Determines the presence and concentrations of samples. • Determines the purity of a sample. • Look at the change of samples over time.
OVERVIEW OF QUANTITIVE SPECTROPHOTOMETRY A. Measure the absorbance of standards containing known concentrations of the analyte B. Plot a standard curve with absorbance on the X axis and analyte concentration on the Y axis C. Measure the absorbance of the unknown(s) D. Determine the concentration of material of interest in the unknowns based on the standard curve
Useful Links http://web.umr.edu/~gbert/color/AAcolor.html http://www.chm.davidson.edu/java/spec/spec.html