Download

1 / 20
200 likes | 451 Views
A High Throughput Computing Analysis of Rounding in the Beer Distribution Game. Nathan Patterson Dr. Jeffrey Rhoads Dr. Sangtae Kim njpatter@purdue.edu 04.22.2009. The Beer Distribution Game. Four players Two week ordering delays Two week shipping delays Three week factory production.

E N D
A High Throughput Computing Analysis of Rounding in the Beer Distribution Game Nathan Patterson Dr. Jeffrey Rhoads Dr. Sangtae Kim njpatter@purdue.edu 04.22.2009
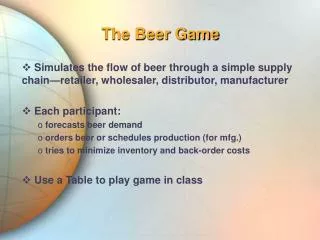
The Beer Distribution Game • Four players • Two week ordering delays • Two week shipping delays • Three week factory production
The Beer Distribution Game • Exogenous Customer demand • Goal of players is to minimize cost • Illustrates nonlinear supply chain behavior • Bullwhip effect
Ordering Heuristic • Single decision variable for each supply chain member • John Sterman (MIT) • Data from 192 students playing the Beer Game • Developed an Anchoring and Adjustment heuristic to mimic players’ behavior
Ordering Heuristic • Four variables • Expected demand updating rate (anchor) – θ (0,1) • Stock discrepancy adjustment – α (0,1) • Supply line discrepancy adjustment – β (0,1) • Desired stock and supply line level – Q (12,17) • Rounding methods • No rounding, continuous variables • Ceiling function • Conventional rounding, nearest integer • Floor function
Response Identification Method • Uses Euclidean distance to determine system states • Constant-Valued • Periodic • Aperiodic • Tolerance of 10-8 was used • Allows code to stop when Constant-Valued solution occurs • Test for periodicity if Constant-Valued solution does not occur within 100,000 weeks
Performance and Rounding • Discrete- vs. continuous-valued implementations • Metrics used to analyze different rounding techniques • Average steady-state operating cost ($0.50 holding and $2.00 backorder costs) • Percentages of Constant-Valued, Periodic, and Aperiodic system responses
High Throughput Analysis • Previous work investigated α-β space for specified θ and Q values • Similar observations were made • 1001x1001 (α-β) variable sets • 4 rounding methods • Separated into 1001 jobs • 800mb data files ready within a few hours
High Throughput Analysis • Expanded upon previous analysis • 201x201x201 (α-β-θ) variable sets • Six Q values ranging from 12 to 17 • Four rounding methods • 194,894,424 variable possibilities • Separated into 40401 jobs
Cost Ratio Analysis • Holding and backorder costs can vary widely • Holding cost to backorder cost ratio analysis • Ceiling function is best • When holding costs < backorder costs • Floor function is best • When holding costs >> backorder costs • Conventional rounding for intermediate ratios
Rounding Summary • High throughput numerical simulations allowed for observations of effects of rounding on solution types and system cost • Rounding – the value of the Ceiling function • Largest constant-valued steady state regions • Lowest average operating cost • Importance of cost ratio analysis • Used to determine rounding method if cost is priority • Aggressive ordering is better • Don’t need 100k weeks to study CV responses
Resources Used • Used Condor high-throughput computing platform • On average used 1000-2000 computers on campus at a time • Lots of time spent transferring files • Used csh script to submit jobs • Resources used to date • Over 4.5 million job submissions • 1,350,000+ CPU hours (>150 CPU years used!)
Acknowledgements • Donald W. Feddersen Endowment • Condor Project (www.cs.wisc.edu/condor) • Rosen Center for Advanced Computing • Phil Cheeseman