Download
1 / 57
580 likes | 894 Views
STUDY DESIGNS: case control, cohort and qualitative. Dr TAMSIN Newlove-delgado Academic registrar in public health. Aims and objectives. To outline and revise: Aetiology and causation Case control study design, advantages and disadvantages The odds ratio

E N D
STUDY DESIGNS:case control, cohort and qualitative Dr TAMSIN Newlove-delgado Academic registrar in public health
Aims and objectives • To outline and revise: • Aetiology and causation • Case control study design, advantages and disadvantages • The odds ratio • Cohort study design, advantages and disadvantages • Relative risk • To summarize some key points about qualitative study design: • Use • Methods • Quality in qualitative studies
Relevant Paper 3 Syllabus • 3.1.10. Knows the benefits and weaknesses of different quantitative study designs to address different clinical questions: • Case-control • Cohort • 3.6 Critically appraises cohort and case control studies
Relevant Paper 3 Syllabus • 3.4. Qualitative Methods • Knows when to apply qualitative research methodologies • Additional approaches to sampling in qualitative studies • Different approaches to data gathering in qualitative studies • The role of qualitative methodologies in instrument (i.e. screening, diagnostic, outcome measure) development • Methods for validating qualitative data • Methods for minimising bias • Methods of analyzing data • Data saturation • 3.6 – Critically appraises qualitative research
Plan of afternoon • 1pm-2.30pm – Case control and cohort studies: including coffee break and exam questions • 2.30pm – 3.30pm approx – Qualitative studies
RCT: not always the answer1 • Unnecessary • Impractical/Unethical • Inappropriate • Prognosis • Diagnosis • Quality issues • And more
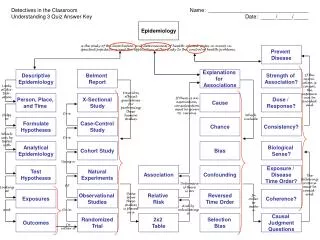
Investigating aetiology • Epidemiological studies of aetiology are usually observational not experimental • An observed association may be due to: • True cause • Reverse causation • Chance (random error) • Bias (systematic error) • Confounding • Happy with these concepts?
Questions of causation • The Bradford-Hill criteria (J Roy Soc Med 1965:58:295-300) • 1. Strength of the association.2. Consistency of findings.3. Specificity of the association.4. Temporal sequence of association.5. Biological gradient.6. Biological plausibility.7. Coherence.8. Experiment. • Can you think of examples where this doesn’t work?
Advantages • Efficient for studies of rare diseases and diseases with long latent periods • Cheap, simple, quick (in comparison to cohorts) • Can examine multiple exposures – generate hypotheses • Sometimes the only practical option (e.g. where long latent period between exposure and disease)
Disadvantages • There are many! • Can study only one outcome • Notorious for being prone to bias: • Sampling/selection bias – selection of cases and controls • Observation and recall bias • Not good for rare exposures • The temporal sequence between exposure and disease may be difficult to determine. • As with all studies, confounding
Selecting cases • Need a clear case definition and source • Incident or prevalent cases? • Cases selected for a study should be representative of all cases of the disease in the population. • Should be a random sample of all patients with the disease • This is difficult!: many cases not diagnosed or misdiagnosed • A hospital sample in some diseases may be very different from a community sample
Selecting controls • Controls are used to estimate the prevalence of exposure in the population which gave rise to the cases. • The ideal control group would comprise a random sample from the general population that gave rise to the cases. • Controls should meet all the criteria for cases, apart from having the disease itself; but they should have the potential to develop it • Recruiting more than one control per case may improve the statistical power of the study (up to 4 controls per case)
Selecting controls • Convenience sample • Matched sample • Using two or more control groups • Using population base sample e.g. from registers
Selecting controls: matching • Matching – Some studies are matched to select cases/controls who are as similar as possible e.g on age, ethnicity etc • Difference between cases and controls therefore cannot be a result of differences in the matching variables – for example, to take age into account • Can be useful in small samples – as we might not have sufficient subjects to adjust for several variables at once. • Difficult/complicated to match on too many factors.... In a large study with many variables it is easier to take an unmatched control group and adjust in the analysis for the variables on which we would have matched, using ordinary regression methods. • Important not to match on basis of risk factor of interest / too many factors – ‘overmatching’ may make the controls unrepresentative and underestimate the true difference • Matching means effect on disease of matched variables cannot be studied
Example of selection bias • Bias introduced through poor selection of controls • Case control studies of NSAIDS (exposure) in colorectal cancer3
Case control studies in psychiatry • Suicide a popular subject……. • Barraclough, B., Bunch, J., Nelson, B., et al (1974) A hundred cases of suicide: clinical aspects. British Journal of Psychiatry, 125, 355-373. • More modern examples: • Fuller Torrey E, Rawlings R, Yolken RH. The antecedents of psychoses: a case-control study of selected risk factors. SchizophrRes2000; 46: 17–23.
Case control studies and the odds ratio • Estimates the strength of association between an exposure and an outcome • Does not calculate relative risk as retrospective • Does not give incidence/prevalence – unless all cases in a population are included • The odds ratio is a measure of the odds of exposure in the cases, compared to the odds of exposure in the control group.
OR: 2 by 2 table OR = (a/c)/(b/d)
Imaginary example– are cats associated with schizophrenia? • Odds of exposure in the cases: 80/20 = 4 • Odds of exposure in the controls: 100/300 = 0.33 • Odds ratio: 4/0.33 = 12.12 • So……the odds of having had a cat as a child in the group with schizophrenia were over 12 times the odds of having had a cat as a child in the control group – • Or those with schizophrenia were over 12 times more likely to have had a cat as a child….
Feline bias • Selection bias • Cases recruited through a charity that runs ‘pet experiences’ for people with mental illness • Controls were a hospital sample recruited from an allergy clinic • Both of these would spuriously increase estimate of effect • Recall bias • Are those with schizophrenia more likely to remember/report having had a cat – particularly if aware of hypothesis in question
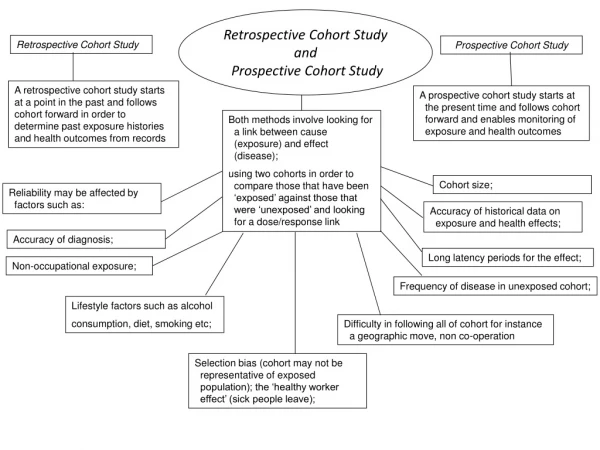
Cohort study design • Usually prospective; but can be retrospective
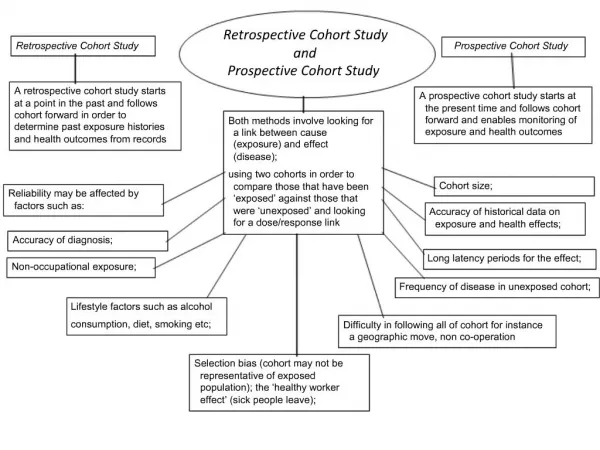
Prospective and retrospective cohort • Cohort studies may be prospective or retrospective, but both types define the cohort on the basis of exposure, not outcome. • Prospective cohort studies – participants are identified and followed up over time until the outcome of interest has occurred, or the time limit for the study has been reached. A temporal relationship between exposure and outcome can be established. • Retrospective cohort studies – exposure and outcome have already occurred at the start of the study. Pre-existing data, such as medical notes, can be used to assess any causal links, so lengthy follow-up is not required.
Advantages • Can investigate risk factors impossible to study in controlled trials - e.g. smoking or asbestos • Describe incidence and natural history • Multiple outcomes can be measured for any one exposure. • Exposure is measured before the onset of disease (in prospective cohort studies). • Good for measuring rare exposures, for example among different occupations. • Demonstrate direction of causality. • Can calculate relative risk
Disadvantages • Expensive, time consuming • Loss to follow up can introduce bias • Need a large sample size – especially for less common outcomes • Not good for rare outcomes or long latency periods • Need to maintain consistency of follow up over time • Systematic misclassification of exposure or outcome status – information bias
Sources of bias in cohort studies • Differential misclassification: can lead to an over- or underestimate of the effect between exposure and outcome. • Losses to follow up : degree to which losses to follow up are related to either exposure or outcome can lead to serious bias in the measurement of effect of exposure and outcome.2
Cohort studies in psychiatry: example • Andreasson et al: cannabis consumption and development of schizophrenia in a cohort of 45,570 Swedish conscripts4.
Relative risk in cohort studies • Analysis • Riskexp = a / (a+c) (divide by total exposed) • Riskunexp = b / (b+d) (divide by total unexposed) • Estimate relative risk = Riskexp / Riskunexp • Indicates increased/decreased risk of disease assoc with exp: • RR = 1 – risk is same in exposed and unexposed groups • RR > 1 – risk is greater in exposed group • RR < 1 – reduction in risk in exposed group
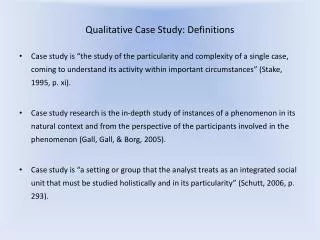
Qualitative studies • Answers questions such as: • What is X & how does X vary in diff circumstances & why? • Not ‘how big is X or how many X’s are there? • Concerned withmeanings people attach to their experience of social world & how make sense of world
Uses of qualitative research • Preliminaryto quantitative research • Helps ensure validity of data obtained • E.g. interviews to inform a survey • To validate quantitative research or provide a diff perspective on same social phenomena • Used independently to uncover social processes or access areas of social life not amenable to quantitative research • Address the 'gap' between evidence-based approaches based on the findings of randomised control trials and the practice of clinical decision-making in individual cases
Qualitative research methods: data gathering • Interviews • Focus groups • Observational/ethnographic
Interviews • Structured • Semi-structured • Depth interviews • Consider: recording • Reflexivity
Note on Reflexivity5 • The researcher is not a neutral/mechanical tool • The researcher is not doing an experiment in which she/he sets the agenda • The person/people the researcher talks to are not inanimate objects, they also have agency and may try to set the agenda themselves • All social research, especially qualitative social research, hinges on social relationships: • They are affected by interpersonal dynamics and • The researcher AND researched 'co-produce' social encounters. • Reflexivity is reflecting, or thinking critically, carefully, honestly and openly, about the research experience and process.
Focus groups • Strengths • Help to identify group norms/cultural values • Group processes can help people to explore and clarify their views in ways that may be less easily accessible in interview • Can encourage participation from those reluctant to be interviewed • Can encourage contributions from people who feel have nothing to say • Weaknesses • Not easy option - data generated can be complex • Potential issues with confidentiality, or with ‘sensitive’ topics
Observational/ethnographic • Instead of asking questions about behaviour – the researcher systematically watches people and events to observe everyday behaviours and relationships • Aspires to be ‘naturalistic’ in that people are studied in situ with as little interference by the researcher as is feasible and ethical • Covert or overt • Participant or non-participant
Observational/ethnographic • Choice of setting is purposive • Consider characteristics of researcher, group and setting • Male, female • Young, old • Naïve or experienced • Accepted by group but don’t ‘go native’! • Ethical issues • Covert research roles must be justified • Recording observational data • Relies on researcher acting as research instrument and documenting the world they observe • Good memory • Clear and detailed recording • Jotted notes • Sift, decode and make sense of data to make meaningful
Sampling in qualitative research • Often a smaller sample size • Rich in detail • Phenomenon only needs to appear once • Not describing incidence/prevalence or statistical significance • Quantitative research uses probability sampling • Qualitative research uses non-probability sampling • not representative samples • findings cannot be generalised to the whole study population from which the sample was taken. • the people in the study population do not each have an equal chance of being selected.
Sampling in qualitative research • Purposive sampling • individual participants are selected deliberately for their specific characteristics that are of importance to the study • Quota based sampling • A quota is a defined number that must be included in a sample :ensures that a certain number of subjects from different subgroups with specific characteristics appear in the sample, so that all these characteristics are represented. • Snowball sampling • Useful for hard-to-reach groups/populations • Start with one or two contacts, ask for referrals/recommendations etc • Theoretical sampling: sampling related to previously developed hypotheses or theories
Analysing qualitative data (1) • Data preparation • Nature and scale of qualitative data • Transcription • Notes made during observation have to be turned into detailed descriptive accounts • Relationship between data and analysis • Transcripts provide descriptive record – not explanations • Analytical process begins during data collection as data already gathered are analysed and feed into/shape ongoing data collection QUANT QUAL Collect Collect Analyse Analyse