Brain Interface Design for Asynchronous Control
Brain Interface Design for Asynchronous Control. Event Related Potentials (ERP) - ERP is any measured brain response that is directly the result of a thought or perception. - ERPs can be reliably measured using electroencephalography (EEG). Event Related Potentials.


Brain Interface Design for Asynchronous Control
E N D
Presentation Transcript
Event Related Potentials (ERP) - ERP is any measured brain response that is directly the result of a thought or perception. - ERPs can be reliably measured using electroencephalography (EEG). Event Related Potentials A wave showing several ERP components, including the N100 and P300
What is the Outlier Processing Method(OPM) • OPM is the method that extract the outlier which mean the event-related • potentials(ERPs) • yi = xi + vi • - Yi is the measured value of the observed process at time i. • - Xi is the value of the ongoing process • - Vi is the value of the outlier process which is assumed independent xi
What is the Outlier Processing Method(OPM) Stimulated outlier extraction using GM2, LSQ, GM, and GM1 Parameter Estimates • The results indicated that the extraction process preformed better GM2 than with GM, • LSQ estimates while the performance with GM1 and GM2 were similar
EventRelated (De)synchronization • Event Related (De)synchronization (ERD/ ERS) - Certain events can block or desynchronize the ongoing alpha activity. - These type of changes can be detected by frequency analysis. - Decrease or increase of power in specific frequency bands. ERD and ERS is defined as the percentage of power decrease or increase - the power within the specific frequency band in the period after the event:PB - the power in the baseline : Pref
Method of Detecting IC and NC • OPM • This method estimates ERPs using the AR model and various parameter estimators. • Using estimated ERPs, the original signal separated by IC and NC • ERD • This method detected ERD by decreasing of power in specific frequency bands. • Using ERD, the signal is separated by IC and NC
Method of Detecting IC and NC • LF-ASD • They find the feature that VMRPs has higher relative power than NC state in 1-4Hz bandwidth via time-frequency analysis of EEG pattern. • Feature extractor • Analysis of 1-4Hz bandwidth with bi-scale wavelet: w(a, b) • The robustness of feature prediction was improved by pairing elemental features by correlation • After this procedure, Bi-scale wavelet. When b is zero, the strongest features were observed. So analysis was implemented at zero value of b. Where di represents the time shift : This vector was equally weighted with each dimension reflecting the value of and aggregate feature.
Method of Detecting IC and NC • LF-ASD • Feature classifier: • Using this feature, they has developed the low-frequency asynchronous switch design(LF-ASD) • Output of the classifier was turned on: value = 1 • Output of the classifier was turned off: value = 0 Classification Method: 1-NN Feature Space Modeling: LVQ3 Classification Method: 1-NN Feature Space Modeling: LVQ3 12-bit ADC
Data Glove. • Data glove is a sensing device for • hand motion using motion sensors • such as accelerometer, gyroscope, • bend sensor, and so on. • Data glove based on bend sensor • is used for training finger movement.
Training Section • The desired movement was explained to the subject and the subject was allowed to practice while investigator watched and corrected the subject`s motion. • A nonstandard finger flexion was selected as the target movement because it was assumed to be new to all subjects. • The investigator used visual inspection of averaged finger movement to maintain similarly. • After training, the subject was allowed to practice until at least 60% of movements were recognized.
Electrode placement for Experiments They chose to limit the features to the top six primarily because these features were the minimal set that provided uniform coverage of the motor areas (SMA, MI) of the cortex. The strongest discriminatory features were found in autocorrelations within six electrode pairsF1-FC1, Fz-FCz, F2-FC2, FC1-C1, FCz-Cz, and FC2-C2 on the 10-20 system for electrode placement. Region of the motor cortex Electrode placement for LF-ASD
Data Collection • The center ball moved through a visual angle of 2 degree up to down or side to side. • The second ball marked 2 moved randomly throughout the space. • The boundary labeled as 3 was either a single-lined or a double-lined rectangle Experimental Display
Data Collection • When the single-line boundary box was displayed, the subject was instructed not to move, but to keep monitoring for possible collisions between the outer and center ball. • When the boundary of the box is changed from a single line to double line, the subject was instructed to try to time their movements for changing the movement direction of the center ball • Data collection continued until 50 successful movements and 10 idle trial were recorded within monitor. Experimental Display
Data Collection • When the single-line boundary box was displayed, the subject was instructed not to move, but to keep monitoring for possible collisions between the outer and center ball. • When the boundary of the box is changed from a single line to double line, the subject was instructed to try to time their movements for changing the movement direction of the center ball • Data collection continued until 50 successful movements and 10 idle trial were recorded within monitor. Experimental Display
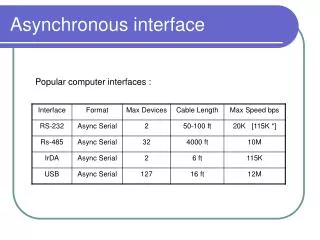
Method of Evaluating Asynchronous Control • method of evaluating asynchronous control that considers both TP and FP rates is the use ofreceiver operating characteristic curves.
Receiver Operating Characteristic • In signal detection theory, receiver operating characteristic is a graph of the sensitivity for binary classifier system. • Define an experiment from positive and negative. The four outcomes can be formulated in a 2x2 confusion matrix Confusion matrix
Receiver Operating Characteristic • To draw a ROC, only TP rate and FP rate are needed. • A ROC is defined by FP rate and TP rate as x and y respectively. • TPR : sensitivity, FPR : 1-sensitivity ※ Terminology and derivations from a confusion matrix … Equation 1 … Equation 2 … Equation 3
Receiver Operating Characteristic • Example of ROC
Results ROCC of the three method
Conclusion • Asynchronous control is the most natural and user-friendly mode of device control. • LF-ASD works with high accuracies of more than 97 percent under low FP. • These brain-switches could be used in devices such as environmental controllers or virtual keyboards